The interest rate on EPF was hiked to 8.65 per cent for the last fiscal from 8.55 per cent provided in 2017-18. The EPFO had earlier reduced the interest rate in 2016-17 to 8.65 per cent from 8.8 per cent in 2015-16. Read More
Many
traders use the ancient art of candlestick analysis. Candles give
investors a quick view of the market actions for a day, week, month or a
year. This technique dates back to the seventeenth century, when
Japanese traders used this method to trade rice. Today candles are used
to set up trades and spot trend reversals, but first you will need to
know how to interpret them. In order to create a candlestick chart, you
must have a data set that contains open, high, low and close values for
each time period you want to display.
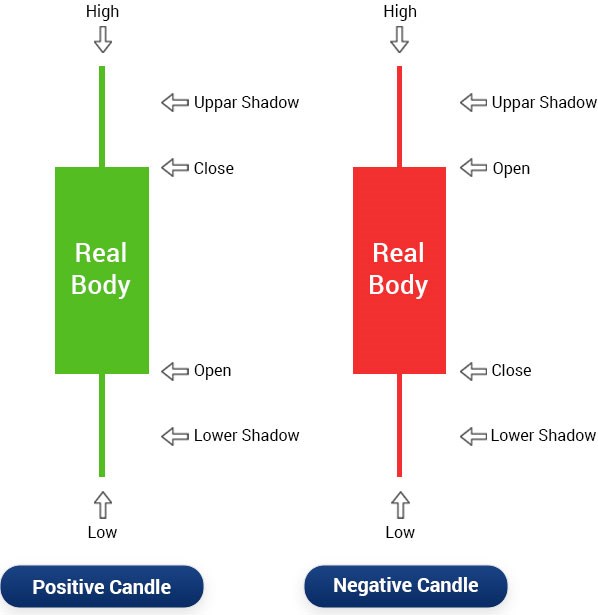
1. Open
2. Close
3. Body of candlestick
4. Shadow
The long thin lines above and below the body of the candle are the wicks (also called shadows or tails). The body of the candle represents the range between the opening and the closing prices. The colour of the body defines whether it was an up or a down period. In our charts we use green and red candlesticks. A long green candle represents a bullish pattern, an uptrend. This shows that the closing price was much higher than the opening one and there was a lot of buying pressure. A long red candle is a bearish pattern and it signals a downtrend. This is when the closing price is significantly lower than the opening one and sellers were aggressive. Generally speaking, the longer the body is, the more intense the buying or selling pressure. Conversely, short candlesticks indicate little price movement and represent consolidation.
1. Close
2. Open
3. Low
4. High
And watch out for the Doji, this powerful candlestick pattern appears when the opening and closing prices are the same. The length of the upper and lower shadows can vary and the resulting candlestick looks like a cross, inverted cross or plus sign. Alone, doji are neutral patterns. They show that neither bulls nor bears were able to gain control and a turning point could be developing.
Doji
The relevance of a doji depends on the preceding trend or
preceding candlesticks. After an advance, or long green candlestick, a
doji signals that the buying pressure is starting to weaken. After a
decline, or long red candlestick, a doji signals that selling pressure
is starting to diminish. Doji indicates that the forces of supply and
demand are becoming more evenly matched and a change in trend may be
near. Doji alone are not enough to mark a reversal and further
confirmation may be needed.
Candlesticks provide unique visual cues that make reading price action easier. Japanese Candlestick Charts allow speculators to better comprehend market sentiment, offering a greater depth of information than traditional bar charts.
KEY TAKEAWAYS
Candlestick charts are used by traders to determine possible price movement based on past patterns.
Candlesticks are useful when trading as they show four price points (open, close, high, and low) throughout the period of time the trader specifies.
Many algorithms are based on the same price information shown in candlestick charts.
Trading is often dictated by emotion, which can be read in candlestick charts.
The Indian economy will grow 7.5% in FY21, 20 basis points lower than earlier projection, says International Monetary Fund.The ADB and the RBI also reduced their 2019-20 growth projection to 7.2% from 7.4% last week, blaming rising risks to global economy and… Read More
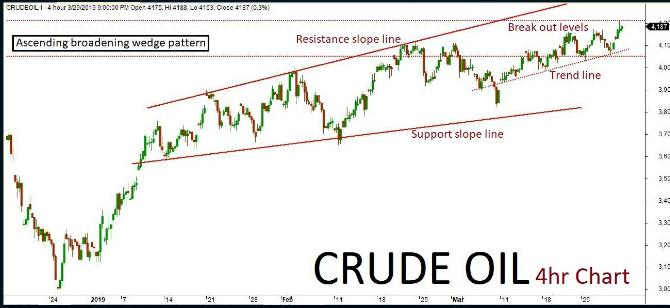
MCX Crude Oil futures technical chart has taken the formation of “Ascending broadening wedge” pattern in 4-hours’ time frame. Previously few sessions ended up in bullish trend along with some corrections inside the channel. As per the technical aspects based on the current price action, the market is expected to continue on a bullish trend. The continuation of the trend will be confirmed once the prices break above a key resistance holding at 4520. The positive rally could be tetest all the way up to 4580 and furthermore levels in the upcoming sessions. An alternative scenario indicates that if the key resistance holds strong then the market might have a chance to retest the same and revise the trend to bearish once again. Such reversal could possibly test up to 4450-4350 levels. Key support holds at 4350.


Recent Comments