MarketWatch CrudeOil MCX Update:
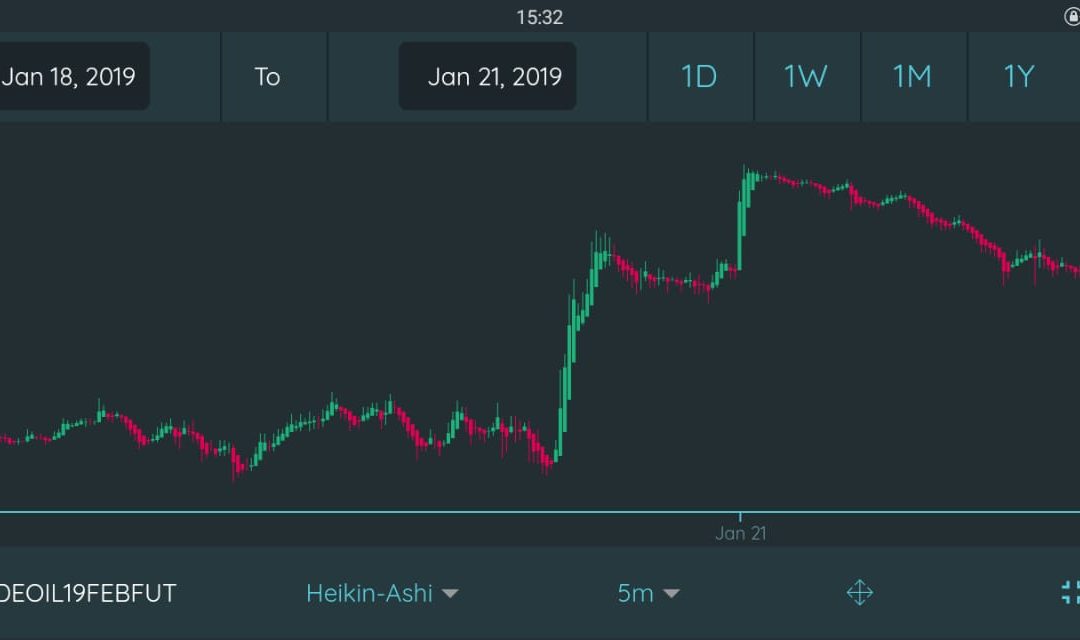
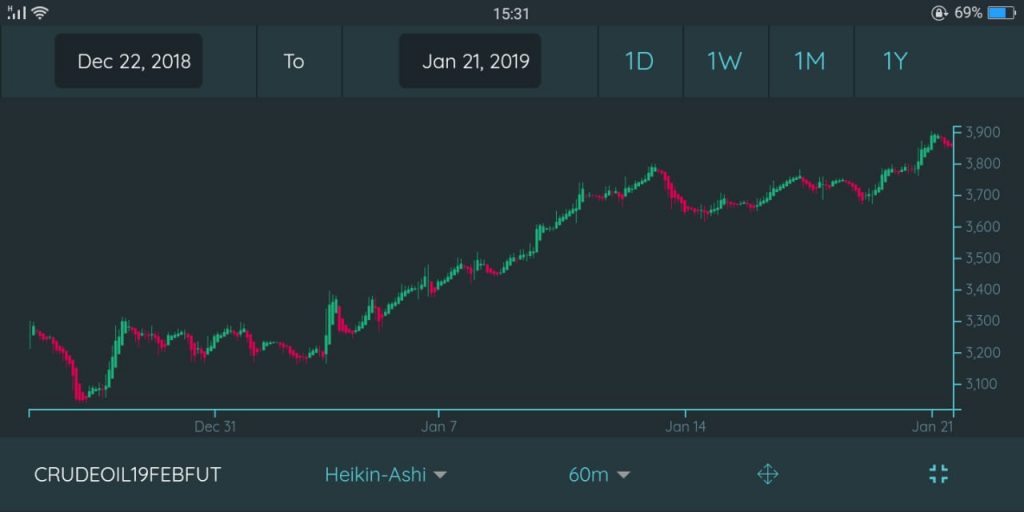
Looking at the Crude Oil Heikin-Ashi Monthly Chart with candle formation at 60 minutes interval, we can clearly decipher an uptrend as we can only spot higher highs. Crude Oil has been definitely performing Bullish since almost Christmas and continued it even after New year, which explains why we might expect some bearish moves this week.
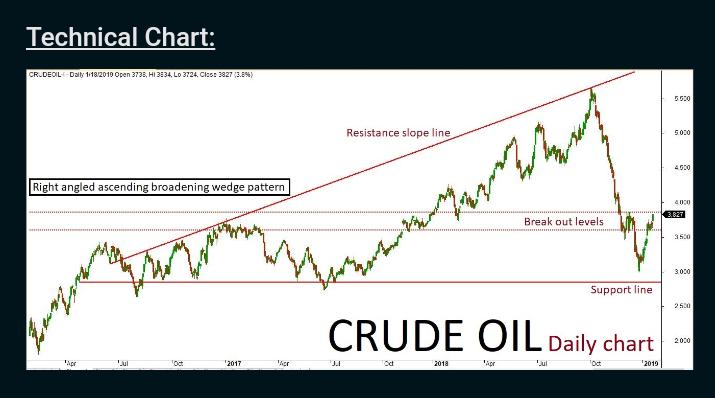
MCX Crude Oil Feb futures technical chart has taken the formation of “Right-angled Rising broadening wedge” pattern in a daily time frame. Previously few sessions ended up in Bullish trend along with some corrections inside the channel. As per the technical aspects based on the current price action, the market is expected to continue on bullish trend. The continuation of the trend will be confirmed once the prices break above a key resistance zone holding at 3840. The positive rally could be testing all the way up to 3950-4000 levels in the upcoming sessions. An alternative scenario indicates that if the key resistance holds strong then the market might have a chance to retest the same and revise the trend to Bearish once again. Such possible reversal could possibly test up to 3700-3600 levels. Key support holds at 3600.
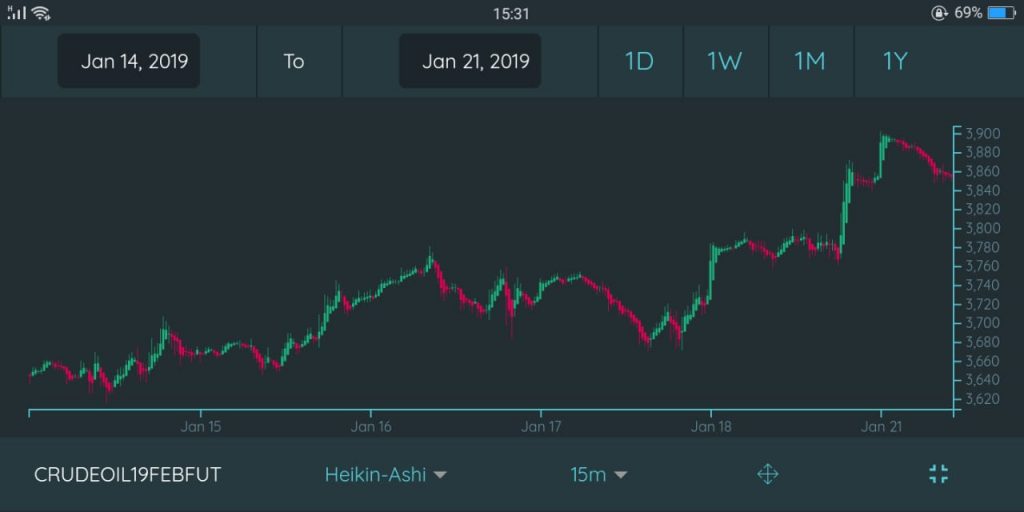
Now, If we look at the past week’s performance of crude oil, we can see the bulls have rallied from 3600 levels to 3800 levels over the period of one week, claiming a strong Bullish trend that can stay for a few more rallies before ending. Accurate support, resistance, and pivot are available on MarketWatch, thus trading along daily ranges defined by
Have you been duped by unscrupulous forex product vendors in the beyond?
Do you have a computer hard drive full of trading manuals and robots that don’t work anymore?
Margin trading enables the forex trader to trade in larger amounts
than he actually has as part live22 free credit. This is
often a double-edged sword, however. A 1% movement in choosing
the right direction could double your trading finances.
A 1% movement against a person wipe out your account. For this reason a novice
trader should gradually increase his leverage over time, don’t have right now high margin trading.
They all think differently and they all have different objectives and
other methods and in addition to say you predict what these vast diverse groups or traders will do in under a
day or less is laughable.
Plus in forex perform trade on your mini details. Suppose you are having lots of money in your bank account but you’re
not likely to willing to place all your investment funds into
it you can open your trading account with at least 300 dollars and you may
apply your own in one-tenth trading tool which is the reason why you will risk necessarily about the
one tenth tool.
In Forex trading, happen to be controlling huge bundles of currency called Lots.
It’s not uncommon for traders to controlling Lots worth $100,000 or additional.
Money is made and lost quickly very good movement of only a few percentage pieces.
You can lose your $500 budget pretty quickly (even with a robot), should
you not take the time to study the markets. Even the
most experienced traders expect to shed money. Beginners will lose the most money, often due to
ignorance of how trading happens.
Now Positive you’re itching to just go and give trading a go.
But before you do, require to realise that it’s
not simple road. In order to trade forex is difficult and when you do trade it can be dangerous.
That’s why I keep away. I make my money online marketing because it is
far simpler and relaxed.
You must follow my strategy because although it works for me, it may work a person personally.
You can search your own trading system by when using the internet or reading text books.
The internet will a person with huge level
of information about option stock trading system. But you preferably
should be careful, since 1 can write in the net you could easily get the
wrong system. It is your job to validate the computer.
Experienced traders who already gained the right amount of understanding the
trading business employ several strategies and accounts depending for their
choice. In case you are still a beginner, you require
to learn essentials first and take most of your
steps carefully and slowly. When you already understand how the market works
for your advantage, you might be ready to take big leaps when in involves decision-making looking out. http://gakozihuzech.mihanblog.com/post/comment/new/92/fromtype/postone/fid/15488764835c51fac328ec4/atrty/1548876483/avrvy/0/key/ae4d1ad52000eda0920425e828b0347d/