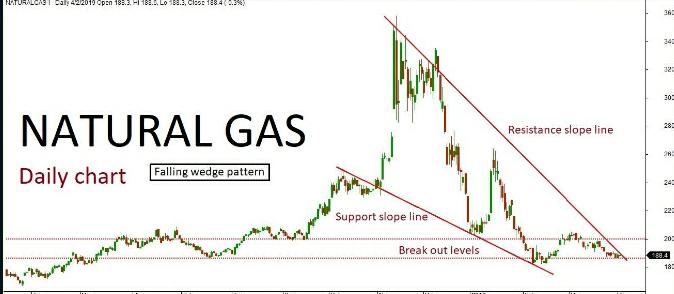
Natural gas daily chart has formed “Falling wedge” pattern. The last few sessions ended up in bearish trend along with some corrections inside the channel. The market is expected to continue on bearish momentum based on the price action, once the same breaks below a key support holding at 186. The downside rally could be testing all the way through 180-175 levels in the upcoming sessions. Alternatively, if the key support holds strong then the market might retest the same and turn bullish once again. The upside rally could test up to 192-200 level. key resistance holds at 200.
Natural Quant Analysis: 02/04/19
Recent Comments