
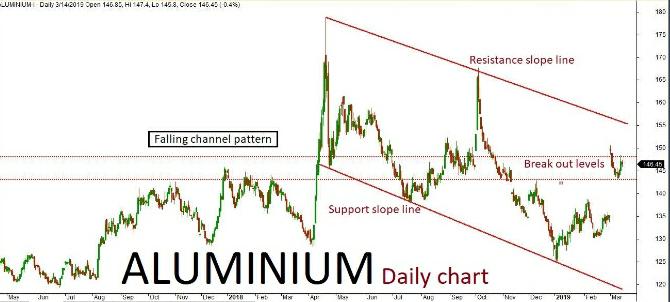
Aluminium daily chart has formed “Falling channel” pattern. The last few sessions ended up in bearish trend along with some corrections inside the channel. The market is expected to continue on the bearish trend based on the current price action, once the same breaks below a key support holding at 144. The downside rally could be testing all the way through 143-141 levels in the upcoming sessions. Alternatively, if the key support holds strong then the market might retest the same and turn bullish once again. The upside rally could test up to 147-149 levels. Key resistance holds at 149.
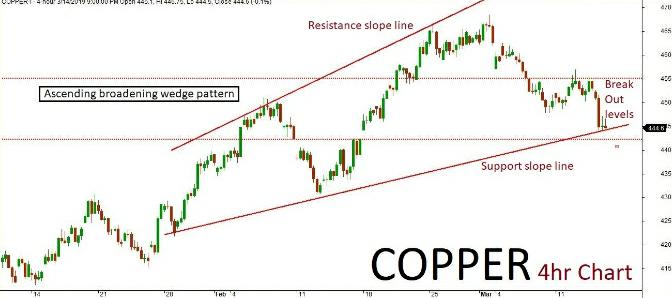
Copper
Copper 4hr chart has formed “Ascending broadening wedge” pattern. The last few sessions been in bearish trend retesting near the channel’s support slope line. The market is expected to continue on bearish momentum based on the current price action, once the same breaks below a key support holding at 442. The downside rally could be testing all the way through 438-434 levels in the upcoming sessions. Alternatively, if the key support holds strong then the market might retest the same and turn bullish. The upside rally could test up to 450-455 level. Key resistance holds at 455.
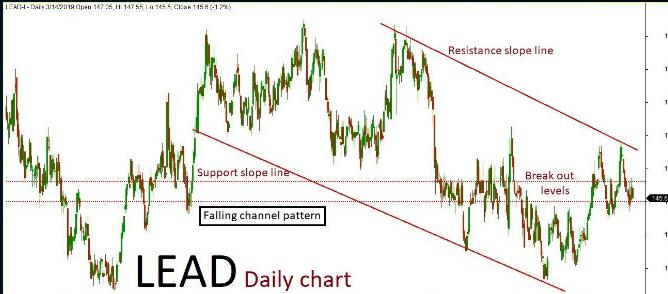
Lead
Lead daily chart has formed “Falling channel” pattern. The last few sessions ended up bearish in trend along with some corrections inside the channel. The market is expected to continue on bearish momentum based on the current price action, once the same breaks below a key support holding at 141. The downside rally could be testing all the way up to 140-139 levels in the upcoming sessions Alternatively, if the key support holds strong then the market might retest the same and turn bullish once again. The upside rally could test up to 147-149 levels. Key resistance holds at 149.
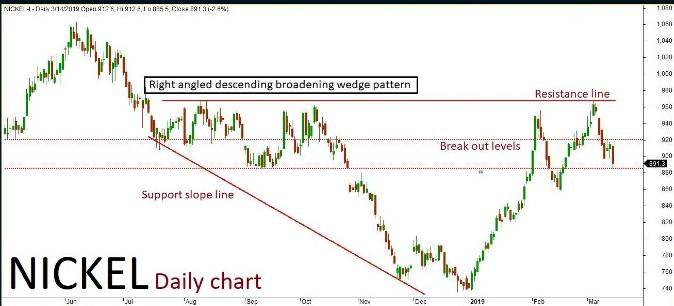
Nickel
Nickel daily chart has formed “Right angled Descending broadening wedge” pattern. The last few sessions been in bearish trend along with some corrections inside the channel. The market is expected to continue on the bearish term based on the current price action, once the same breaks below a key support holding at 885. The downside rally could be testing all the way through 870-860 levels in the upcoming sessions. Alternatively, if the key support holds strong then the market might retest the same and turn bullish once again. The upside rally could test up to 900-920 level. Key resistance holds at 920.
Zinc
Zinc daily chart has formed “Rectangle chart ” pattern. The last few sessions ended up in bearish trend along with some corrections inside the channel. The market is expected to continue on bearish momentum based on the current price action, once the same breaks below a key support holding at 193.50. The downside rally could be testing all the way through 192-190 levels in the upcoming sessions. Alternatively, if the key support holds strong then the market might retest the same and turn bullish. The upside rally could test up to 196-200 levels. Key resistance holds at 200.
Recent Comments