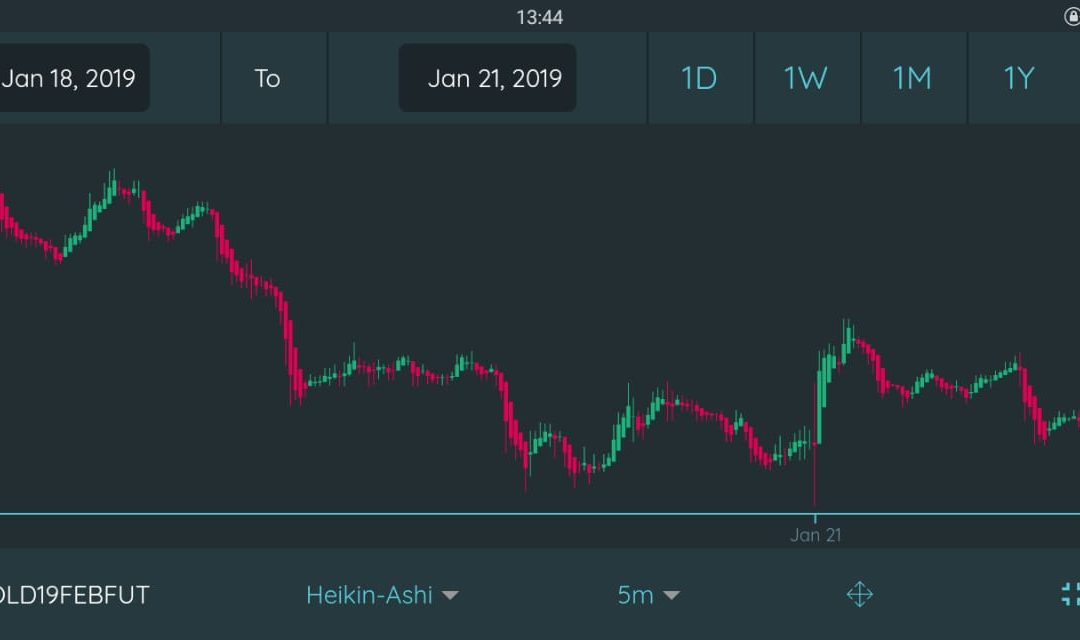
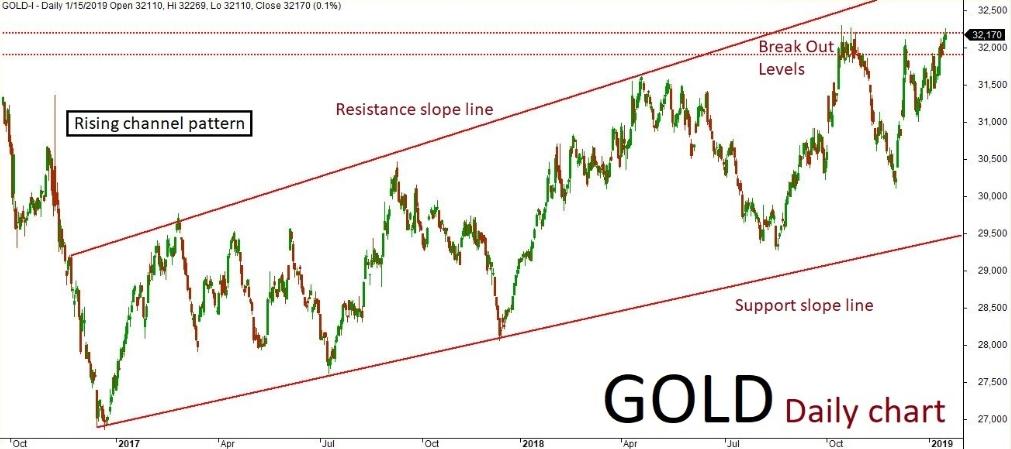
Gold Feb futures technical chart has taken the formation of “Ascending channel” pattern in the daily time frame. Last few sessions ended up bearish in trend along with some corrections inside the channel, where the market is expected to continue on bearish momentum. The continuation of the trend will be confirmed once the prices break below the key support holding at 32050. The Bearish market could probably plummet gold prices all the way down to 31950-31800 levels in the upcoming sessions. An alternate scenario indicates if the key support holds strong then the market might retest the same, revise the trend to bullish once again. The Bullish rally could surge the gold prices up to 32300-32400 levels. Key resistance holds at 32300.
Quantitative Analysis or Quant is a prodedure that tries to understand the behavior or Financial Markets using only mathematics. Quant rely upon statistical modeling, measurement, and research to predict the direction and speed of financial markets.
Analysis of a situation or event, especially a financial market, by means of complex mathematical and statistical modelling.
Dictionary Definition of Quantitative Analysis.
Quantitative analysis is employed for several reasons, including measurement, performance evaluation or valuation of a financial instrument, and predicting real-world events, such as changes in a country’s gross domestic product (GDP).
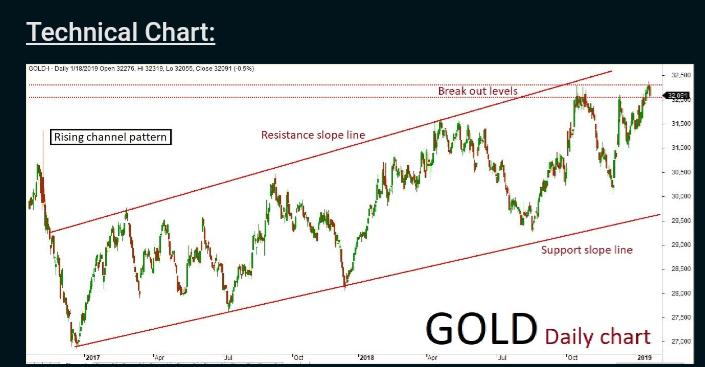
Mcx Gold Feb Futures’s chart has been in the formation of rising channel pattern in the daily time frame since the starting of this year. Last few sessions have been bullish. And the markets are expected to continue on bullish momentum.
The continuation of the bullish trend will be confirmed when the prices break above key resistance zone at 32300. The positive rally could go up to 32400-32500 levels in nearby sessions.
An alternative scenario shows that if the key resistance holds strong, the markets might have a chance to reverse the trend. This may revise the trend to bears once again. The negative rally could go way down to 32200-32100 levels.. While key support holds at 32100 levels.
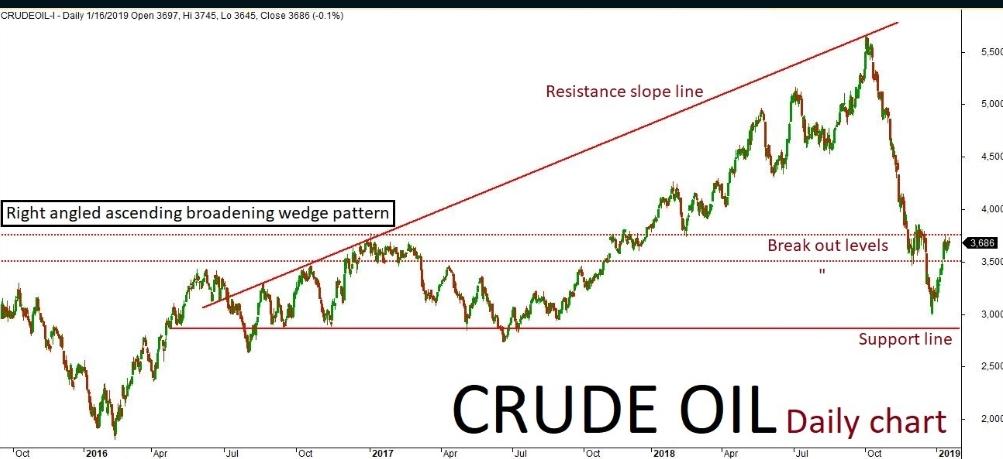
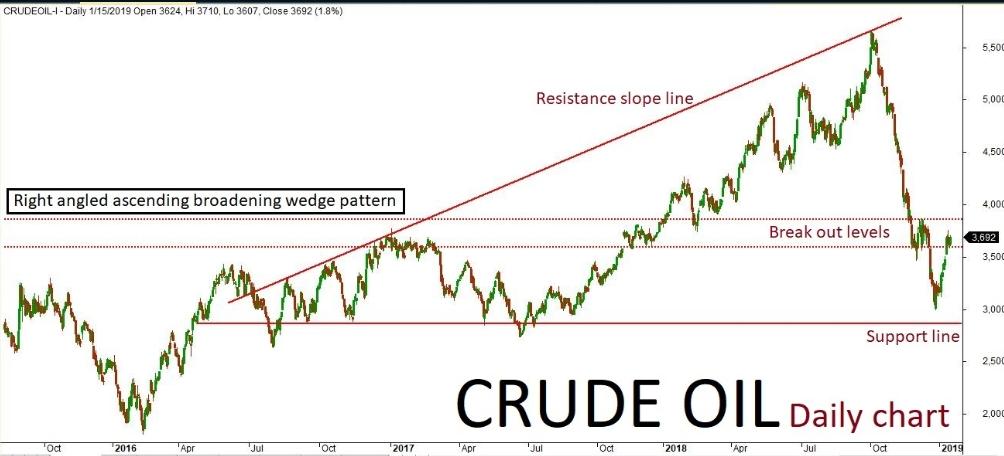
MCX Crude Oil futures chart has been making the “Right angled ascending broadening wedge” for some time now. Nearly all of the previous sessions ended up in bullish trend along with some corrections inside the channel.
As per the technical aspects based on current price actions, crude market is expected to keep on a bullish trend. This continuation of the trend will be confirmed when the price breaks a key resistance zone at 3760. Also, the positive rally could be testing all the way up to 3850-3900 levels in the upcoming sessions.
An alternative scenario indicates that if the key resistance holds strong, then the markets could reverse and revise the trend to bearish again. If this reversal takes place it could test up to 3600-3500 levels. Key support holds at 3500.
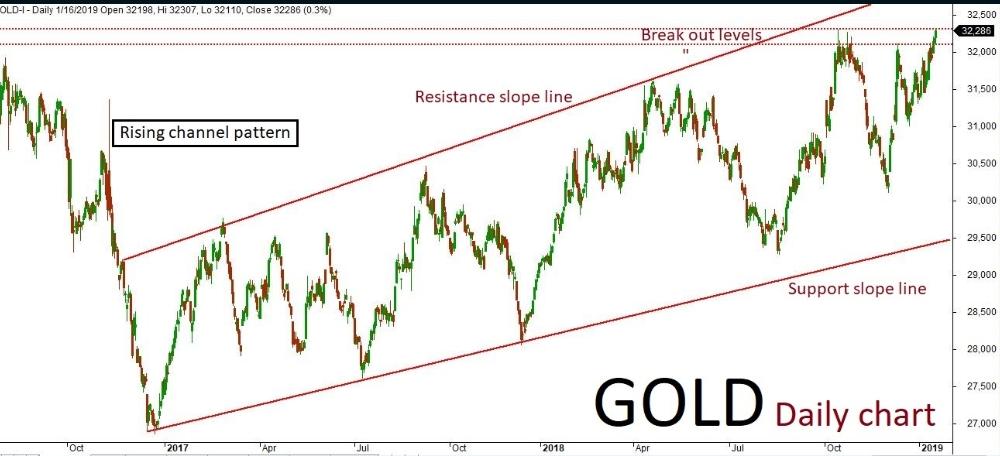
MCX GOld feb fututres technical chart has taken the formation or “Rising Channel” pattern in daily time frame. Last few sessions ended up bullish. And the market is expected to continue on a bullish momentum.
The continuation of the trend will be confirmed once again when the rices breaks above the key resistance zone at 32200. The positive rally could be extending all the way up to 32300-32400.
An alternative scenario indicates that if the key resistance holds strong then the market might have a change to test the same again. And the trend could be reversed to bearish again. The downside rally could test up to 32000-31900 levels. Key support holds at 31900.
MCX Crude Oil futures technical chart is showing a “Right Angled Ascending Broadening Wedge” patter, while picking a daily time frame. Previous few sessions ended up in a bullish trend along with some inside channel corrections.
As per the technical aspects based on the current price action, the market is expected to continue on a bullish trend. The positive rally could test 3760-3860 levels in upcoming sessions. Key resistance holds at 3860.
An alternative scenario indicated that if markets break below 3600, which is a key support then the trend could be revised to bearish once again. Such a break could possibly break up to 3500-3400 levels.

Recent Comments