MCX Gold April futures technical chat has taken the formation of The continuation of the trend will be confirmed once the prices break below a key support zone holding at 33100. The negative relly could be extending all the way up to 33000-32950 levels in the upcoming sessions. The continuation of the trend will be confirmed once the prices break below a key support zone holding at 33100. The negative relly could be extending all the way up to 33000-32950 levels in the upcoming sessions. alternative scenario indicates that if the key support holds strong then the market might have a chance to retest the same and revise the trend to bullish once again. The upside rally could test up to 33300-33450 levels. Key resistance holds at 33450.
Natural gas daily chart has formed” Right angled ascending broadening wedge” pattern. The last few sessions ended up in bearish trend along with some corrections inside the channel. The market is expected to continue on bearish momentum based on the price action, once the same breaks below a key support holding at 190 . The downside rally could be testing all the way through 185-180 levels in the upcoming sessions. Alternatively, if the key support holds strong then the market might retest the same and turn bullish once again. The upside rally could test up to 200-210 level. key resistance holds at 210 .
MCX Gold April futures technical chart has taken the formation of ”Ascending broadening wedge” pattern in the daily time frame. The last session ended up bearish in trend in after few positive rallies inside the channel, where the market is expected to continue on bearish momentum. the negative rally could be extending all the way up to 33300-33200 levels in the upcoming sessions. An alternative scenario indicates that if the market breaks above a key resistance holding at 33600 that it might revise the trend to bullish once again. the upside rally could test up to 33700-33800 levels key support holds at 33200.
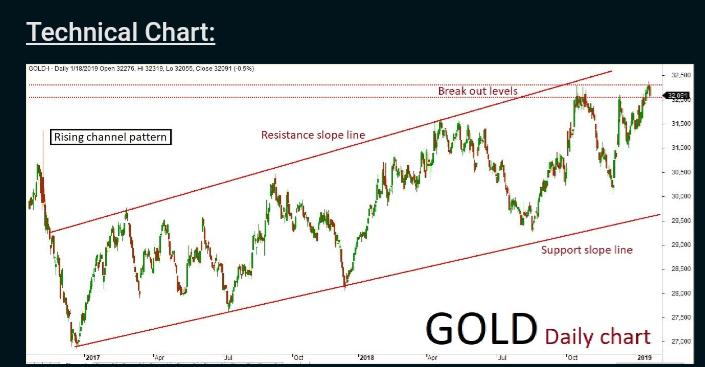
Mcx Gold fed futures technical chart has taken the formation of ” Rising channel ” pattern daily time frame. Last few session ended up bullish in trend along with some corrections inside the channel, where the market is expected to continue on bullish momentum.
Technically Gold market is under fresh buying as the market has witnessed gain in open interest by 10.34% to settle at 17684 while prices up 162 rupees.
Now MCX Gold is getting support at 32943 and below same could see a test of 32789 level, And resistance is now likely to be seen at 33234, a move above could see prices testing 33371.
Gold prices gained as the dollar weakened after the U.S. Federal Reserve paused its monetary tightening cycle. The Fed held U.S. interest rates steady but said it would be patient in lifting borrowing costs further this year as it pointed to rising uncertainty about the economic outlook.
Meanwhile, attention turned towards the U.S. and China high-level trade talks that began on Wednesday, aimed at digging out from their months-long trade war. Investors are worried that Washington’s criminal charges against Chinese company Huawei and its chief financial officer could hurt the talks.
A surge in gold purchases by central banks to the highest since 1967 helped push global demand for the metal up 4 percent last year, the World Gold Council (WGC) said. The world consumed 4,345.1 tonnes of gold in 2018, up from 4,159.9 tonnes in 2017, the WGC said in its latest quarterly demand trends report.
Driving the increase were central banks which bought 651.5 tonnes – 74 percent more than in 2017 and the second highest annual total on record – as countries including China and Poland joined Russia, Turkey and Kazakhstan in adding to their reserves, the WGC said.
Underscoring investor interest in gold, holdings of SPDR Gold Trust, the world’s largest gold-backed exchange-traded fund, were at their highest since June. SPDR gold holdings have climbed 4.6 percent so far this month, the biggest monthly gain since September 2017.
Trading Ideas: –Gold trading range for the day is 32789-33371. –Gold prices gained as the dollar weakened after the U.S. Federal Reserve paused its monetary tightening cycle. –The Fed held U.S. interest rates steady but said it would be patient in lifting borrowing costs further this year as it pointed to rising uncertainty about the economic outlook. –China’s 2018 gold consumption rose by 5.73 percent year-on- year to 1,151.43 tonnes.
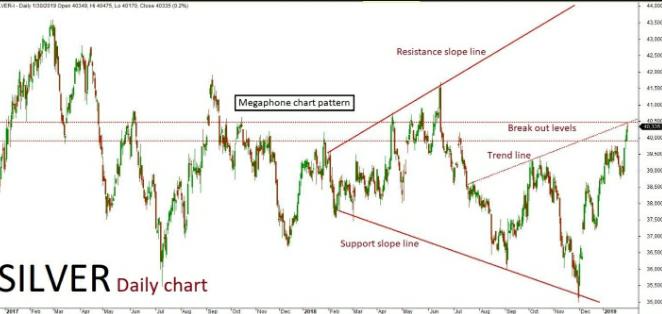
MCX Silver Mar. Futures technical chart has taken the formation of “megaphone chart” pattern in daily time frame. Last few sessions ended up bullish in trend along with some corrections inside the channel,where the market is expected to continue on the bullish trend. The continuation of the trend will be confirmed once the prices breaks above a key resistance holding at 40,600. The positive rally could be extending all the way up to 40600-40800 levels in the upcoming sessions. An alternative scenario indicates that if the key resistance holds strong then the market might retest the same and revise the trend to bearish ones again. The downside rally could test up to 40200-39900 levels. Key support holds at 3900.
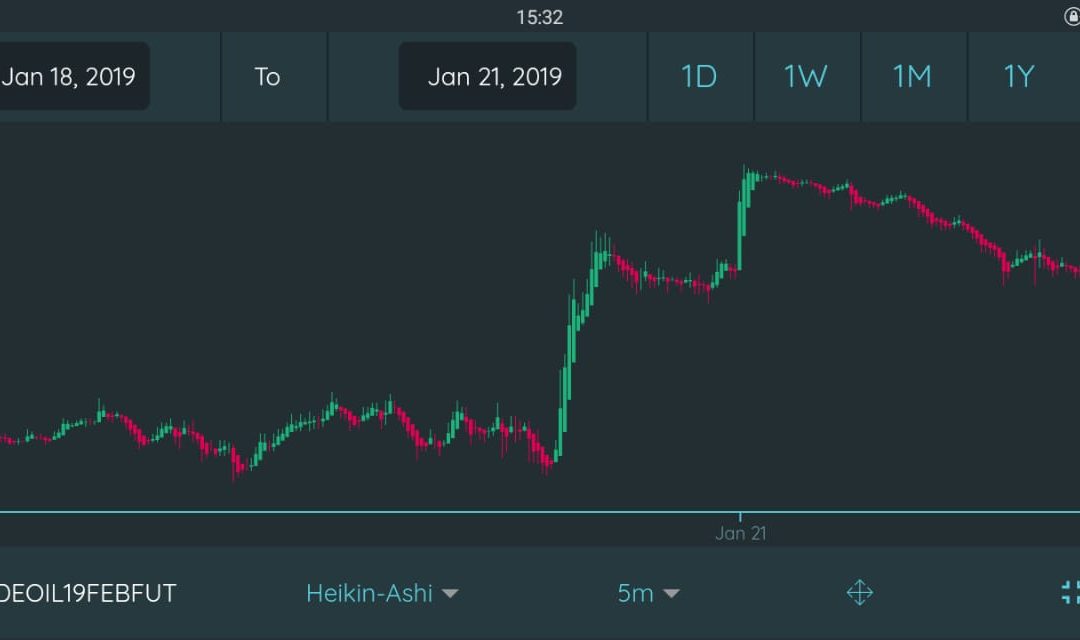
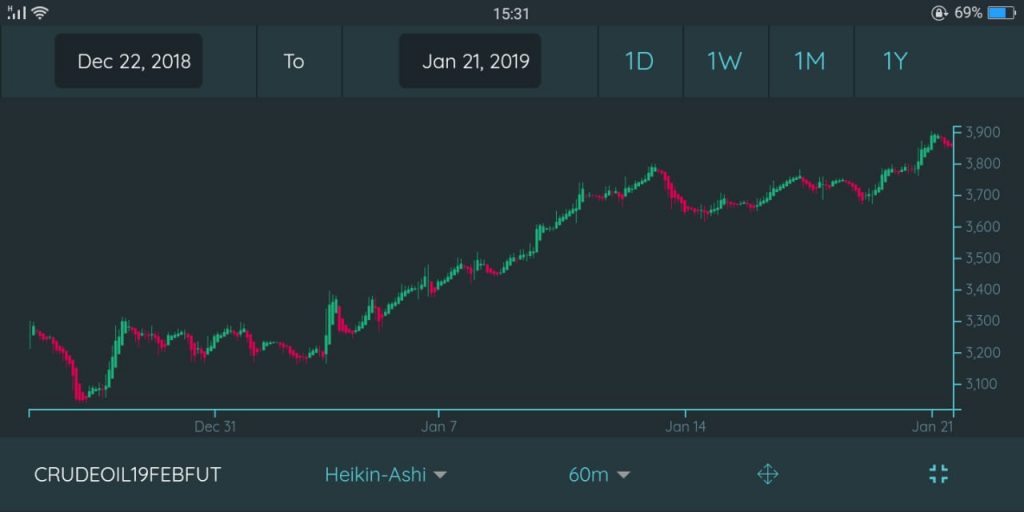
Looking at the Crude Oil Heikin-Ashi Monthly Chart with candle formation at 60 minutes interval, we can clearly decipher an uptrend as we can only spot higher highs. Crude Oil has been definitely performing Bullish since almost Christmas and continued it even after New year, which explains why we might expect some bearish moves this week.
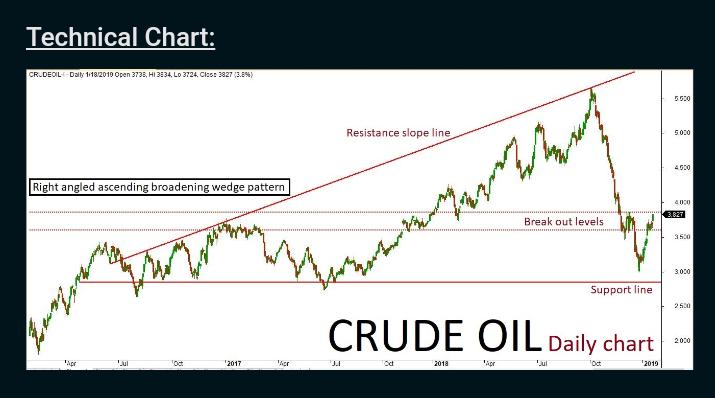
MCX Crude Oil Feb futures technical chart has taken the formation of “Right-angled Rising broadening wedge” pattern in a daily time frame. Previously few sessions ended up in Bullish trend along with some corrections inside the channel. As per the technical aspects based on the current price action, the market is expected to continue on bullish trend. The continuation of the trend will be confirmed once the prices break above a key resistance zone holding at 3840. The positive rally could be testing all the way up to 3950-4000 levels in the upcoming sessions. An alternative scenario indicates that if the key resistance holds strong then the market might have a chance to retest the same and revise the trend to Bearish once again. Such possible reversal could possibly test up to 3700-3600 levels. Key support holds at 3600.
MCX CrudeOil Feb Futures
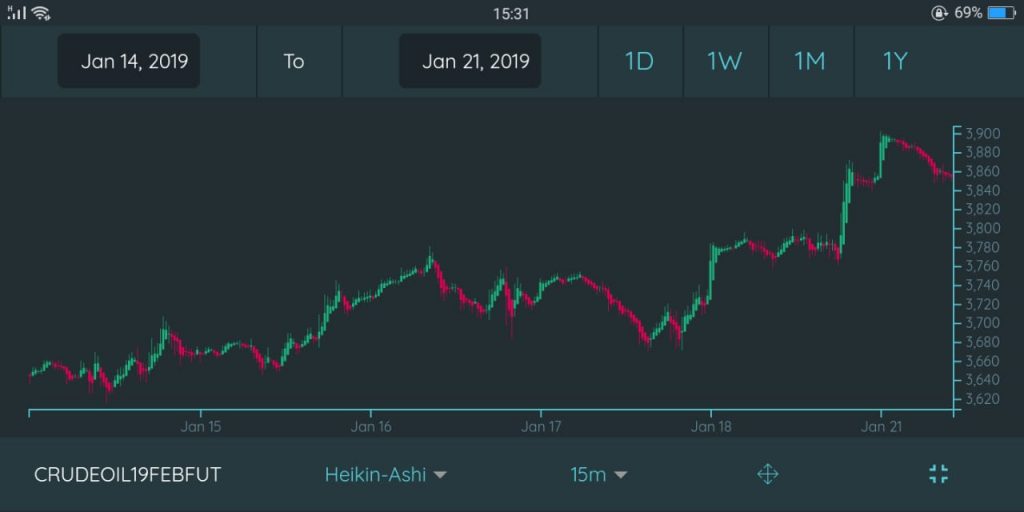
Now, If we look at the past week’s performance of crude oil, we can see the bulls have rallied from 3600 levels to 3800 levels over the period of one week, claiming a strong Bullish trend that can stay for a few more rallies before ending. Accurate support, resistance, and pivot are available on MarketWatch, thus trading along daily ranges defined by support and resistant levels are convenient and easy unless you spot a trend.
Recent Comments