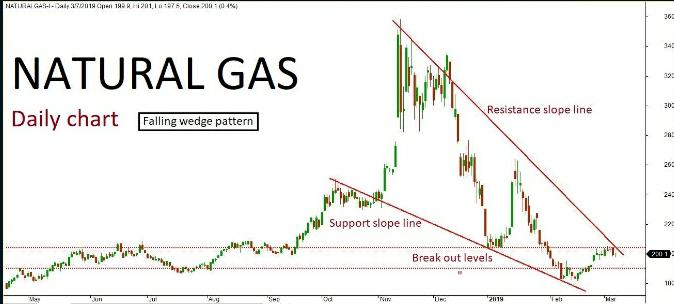
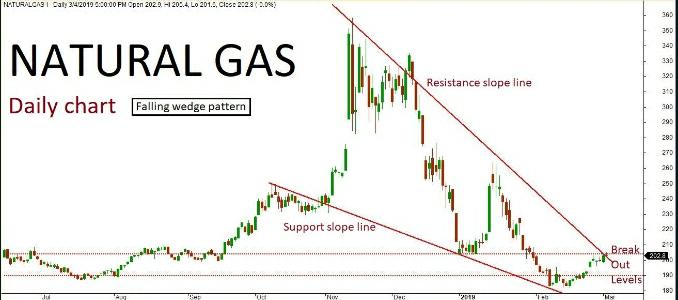
Natural gas daily chart has formed “Falling wedge” pattern. The last few sessions ended up in bearish trend after retesting near the channel’s resistance slope line. The market is expected to continue on bearish momentum based on the price action, testing all the way through 195-190 levels in the upcoming sessions. Alternatively, if the market breaks above a key resistance holding at 204 then it might turn bullish once again. The upside rally could test up to 210-215 level. Key support holds at 190.
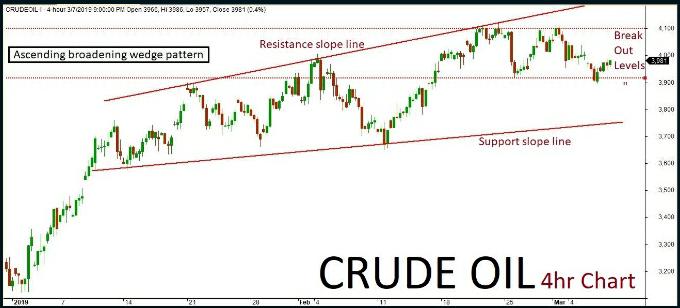
MCX Crude Oil futures technical chart has taken the formation of “Ascending broadening wedge” pattern in 4-hours’ time frame. Previous session ended up bullish in trend and consolidated after few negative rallies inside the channel. As per the technical aspects based on the current price action, the market is expected to continue on bullish trend. The positive rally could be testing all the way up to 4050-4100 level in the upcoming sessions. An alternative scenario indicates that if the market breaks below a key support holding at 3920 then it might revise the trend to bearish once again. Such breaks out could possibly test up to 3800 level. Key resistance holds at 4100.
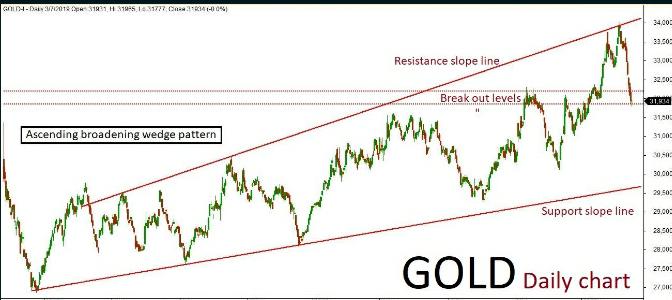
MCX Gold April futures technical chart has taken the formation of “Ascending broadening wedge” pattern in daily time frame. Last few sessions ended up bearish in trend along with some corrections inside the channel, where the market is expected to continue on bearish momentum. The continuation of the trend will be confirmed once the prices breaks below a key support holding at 31850. The negative rally could be extending all the way up to 31800-31700 levels in the upcoming sessions. An alternative scenario indicates that if the key support holds strong then the market might have a chance to retest the same and revise the trend to bullish once again. The upside rally could test up to 32100-32200 levels. Key resistance holds at 32200.
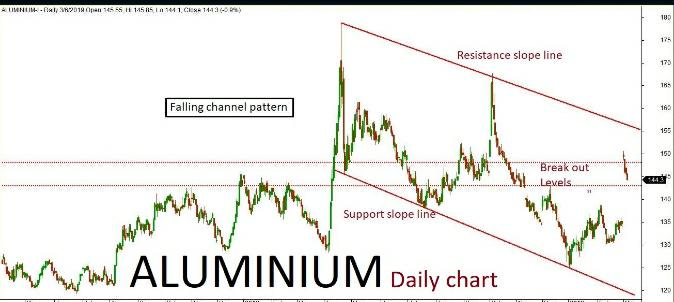
Aluminium daily chart has formed “Falling channel” pattern. The last few sessions ended up in bearish trend after a long gap up formation inside the channel. The market is expected to continue on the bearish trend based on the current price action, once the same breaks below a key support holding at 143. The downside rally could be testing all the way through 142-140 levels in the upcoming sessions,. Alternatively, if the key support holds strong then the market might retest the same and turn bullish. The upside rally could test u to 146-148 levels. Key resistance holds at 148.
Aluminium March Futures
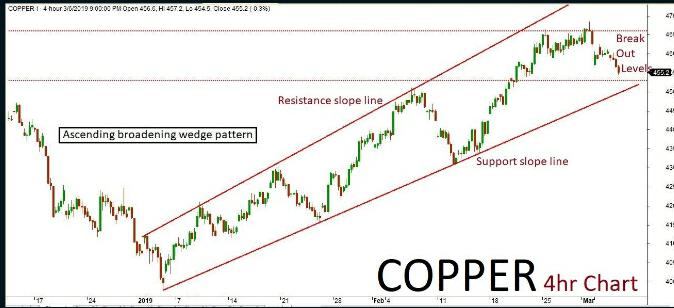
Copper
Copper 4hr chart has formed “Ascending broadening wedge” pattern. The last few session been in bearish trend along with some corrections inside the channel. The market is expected to continue on bearish momentum based on the current price action, once the same breaks below a key support holding at 453. The downside rally could be testing all the way through 450-445 levels in the upcoming sessions. Alternatively, if the key support holds strong then the market might retest the same and turn bullish once again. The upside rally could test up to 460-466 level. Key resistance holds at 466.
Copper March Futures
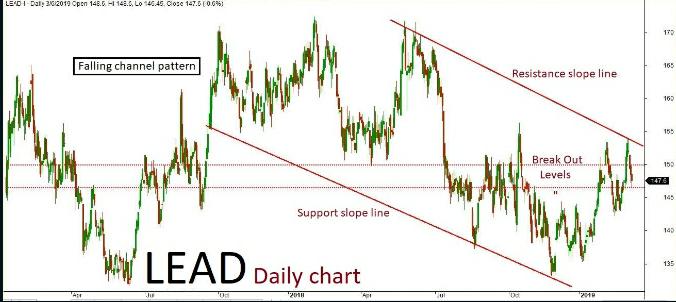
Lead
Lead daily chart has formed “Falling channel” pattern. The last few sessions ended up bearish in trend along with some corrections inside the channel. The market is expected to continue on bearish momentum based on the current price action, once the same breaks below a key support holding at 146.50. The downside rally could be testing all the way up to 145- 144 levels in the upcoming sessions. Alternatively, if the key support holds strong then the market might retest the same and turn bullish once again. The upside rally could test up to 148-150 level. Key resistance holds at 150.
Lead March Futures
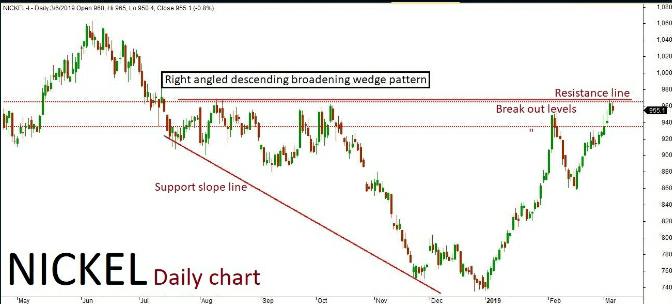
Nickel
Nickel daily chart has formed “Right-angled Descending broadening wedge” pattern. The last sessions have been in a bearish trend after a few positive rallies inside the channel. The market is expected to continue on the bearish term based on the current price action, testing all the way through 945-935 levels in the upcoming sessions. Alternatively, if the market breaks above a key resistance holding at 945 then it might turn bullish once again. The upside rally could test up to 970-980 levels. Key support holds at 935.
Nickel March futures
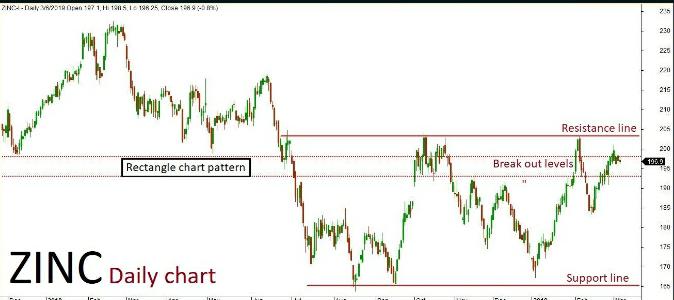
Zinc
Zinc daily chart has formed a “Rectangle chart” pattern. The last few sessions ended up in a sideways trend and also consolidated inside the channel. The market is expected to continue on bearish momentum based on the current price action, testing all the way through 195-193 levels in the upcoming sessions. Alternatively, if the market breaks above a key resistance holding at 198 then it might turn bullish once again. The upside rally could test up to 200-203 levels. Key support holds at 193.
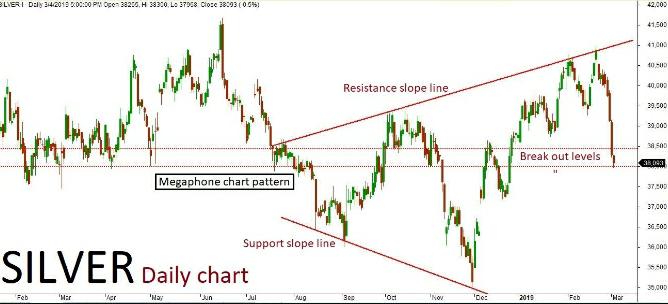
MCX Silver March futures technical chart has taken the formation of “Megaphone chart” pattern in daily time frame. Last session ended up in bearish trend after few consolidations inside the channel, where the market is expected to continue on the bearish trend. The continuation of the trend will be confirmed once the prices breaks below a key support holding at 38050. The negative rally could be extending all the way up to 37900-37700 levels in the upcoming sessions. An alternative scenario indicates that if the key support holds strong then the market might have a chance to retest the same and revise the trend to bullish once again. The upside rally could test up to 38300-38500 level. Key support at 38500.
Natural gas daily chart formed “Falling wedge” pattern. The last session ended up in bearish trend retesting near the channel,s resistance slope line. The market is expected to continue on bearish momentum based on the price action, testing all the way through 195-190 levels in the upcoming sessions. Alternatively, if the market breaks above a key resistance holding at 204 then it might turn bullish once again. The upside rally could test up to 210-215 level. Key support holds at 190.

Recent Comments