Gold Quant Analysis: 09/04/19
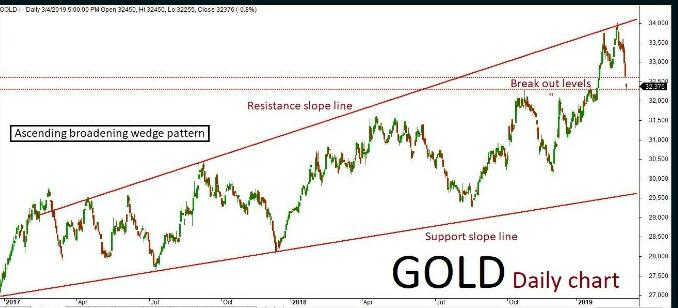
MCX Gold June futures technical chart has taken the formation of “Ascending broadening wedge” pattern in
MCX Gold June futures technical chart has taken the formation of “Ascending broadening wedge” pattern in

MCX Crude Oil futures technical chart has taken the formation of “Ascending broadening wedge” pattern in 4-hours’ time frame. Previously few sessions ended up in bullish trend along with some corrections inside the channel. As per the technical aspects based on the current price action, the market is expected to continue on bullish trend. The continuation of the trend will be confirmed once the prices breaks above a key resistance holding at 4400. The positive rally could be testing all the way up to 4450-4500 levels in the upcoming sessions. An alternative scenario indicates that if the key resistance holds strong then the market might have a chance to retest the same and revise the trend to bearish once again. Such reversal could possibly test up to 4320-4250 levels. Key support holds at 4250.

MCX Gold June futures technical chart has taken the formation of “Rising channel” pattern in daily time frame. Last few sessions ended up bearish in trend along with some corrections inside the channel, where the market is expected to continue on bearish momentum. The continuation of the trend will be confirmed once the prices breaks below a key support holding at 31450. The negative rally could be extending all the way up to 31400-31300 levels in the upcoming sessions. An alternative scenario indicates that if the key support holds strong then the market might have a chance to retest the same and revise the trend to bullish once again. The upside rally could test up to 31600-31700 levels. Key resistance holds at 31700.
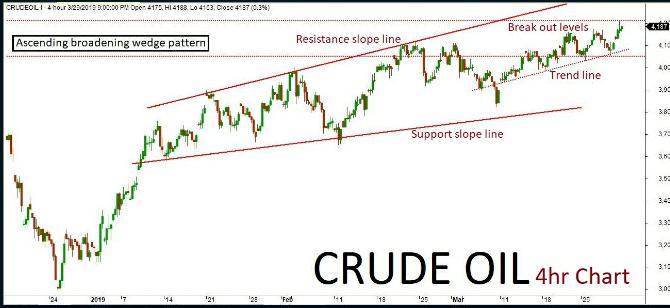
MCX Crude Oil futures technical chart has taken the formation of “Ascending broadening wedge” pattern in 4-hours’ time frame. Previous session ended up in bearish trend after retesting near the channel’s resistance slope line. As per the technical aspects based on the current price action, the market is expected to continue on bearish trend. The negative rally could be testing all the way up to 4220-4150 levels in the upcoming sessions. An alternative scenario indicates that if the market breaks above a key resistance holding at 4350 then it might revise the trend to bullish once again. Such breakout could positive test up to 4400-4450 levels. Key support holds at 4150.

The banks are seeking to seize about 258,000 pounds held in Mallya’s ICICI Bank UK Plc account. They have accused Mallya of willfully defaulting on debts of Kingfisher Airlines, which was founded in 2005 and folded in 2012. The UK resident is fighting his ext… Read More
reported by Thomas Beardsworth at Hindustantimes.com
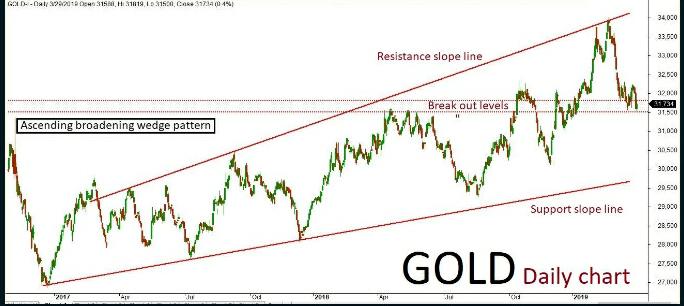
MCX Gold June futures technical chart has taken the formation of “Rising channel” pattern in daily time frame. Last few sessions ended up bearish in trend along with some corrections inside the channel, where the market is expected to continue on bearish momentum. The continuation of the trend will be confirmed once the prices breaks below a key support holding at 31500. The negative rally could be extending all the way up to 31400-31300 levels in the upcoming sessions. An alternative scenario indicates that if the key support holds strong then the market might have a chance to retest the same and revise the trend to bullish once again. The upside rally could test up to 31650-31800 levels. Key resistance holds at 31800.
Recent Comments