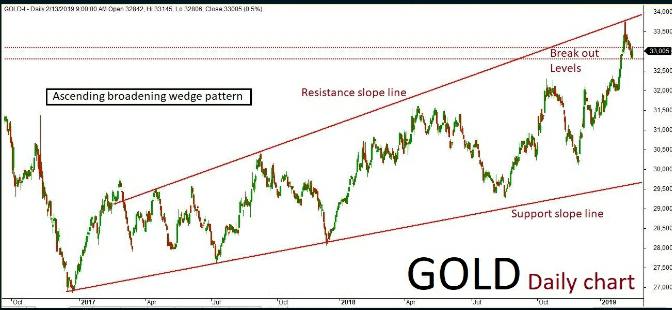
MCX Gold April futures technical chart has taken the formation of “Ascending broadening wedge” pattern in daily time frame. Last session ended up bullish in trend after few negative rallies inside the channel, where the market is expected to continue on bullish momentum. The continuation of the trend will be confirmed once the price breaks above a key resistance holding at 33100. The positive rally could be extending all the way up to 33150-33250 levels in the upcoming sessions. An alternating scenario indicates that if the key resistance holds strong then the market might have a chance to retest the same and revise the trend to bearish once again. The downside rally could test up to 32900-32800 levels. key support holds at 32800.
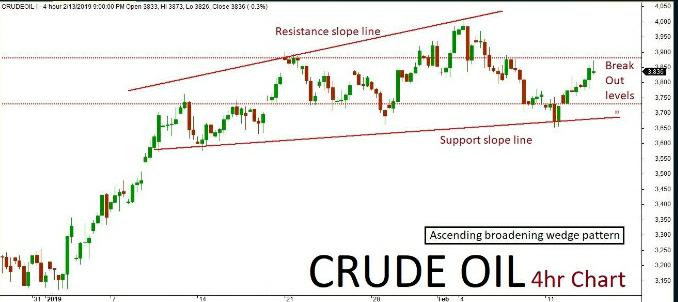
MCX Crude Oil futures technical chart has taken the formation of “Ascending broadening wedge” pattern in 4-hours’ time frame. Previously few sessions ended up bullish in trend end retesting inside the channel. As per the technical aspects based on the current price action, the market is expected to continue on a bullish trend. The continuation of the trend will be confirmed once the prices break above a key resistance holding at 3880. The positive rally could be testing all the way up to 3950-4000 level in the upcoming sessions. An alternative scenario indicates that if key resistance holds strong then the market might have a chance to retest the same and revise the trend to bearish once again. Such reversal could possibly test up to 3780-3730 levels. Key support holds at 3730.
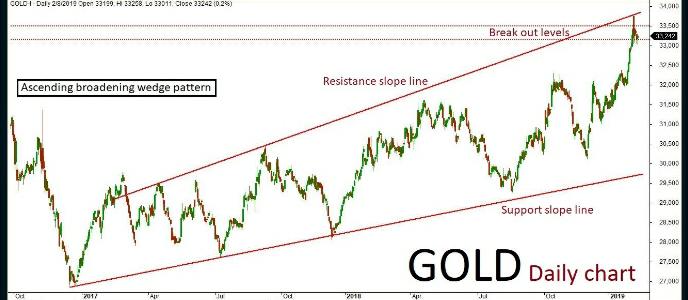
MCX Gold April futures technical chart has taken the formation of “Ascending broadening wedge” pattern in the daily time frame. Last few sessions ended up bearish in trend along with some corrections inside the channel, where the market is expected to continue on bearish momentum. The continuation of the trend will be confirmed once the prices break below key support holding at 32820. The negative plunging could be plummeting all the way up to 32700-32600 levels in the upcoming sessions. An alternate scenario indicates that if the key support holds strong then the market might have a chance to retest the same and revise the trend to BULLISH once again. The upside rally could test up to 33000-33150 levels. Key resistance holds at 33150.
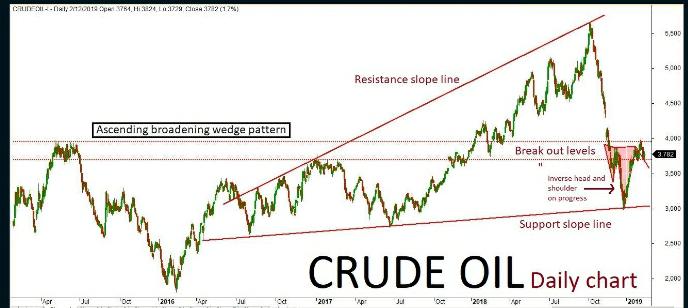
Mcx crude oil futures technical chart has taken the formation of “Ascending broadening wedge” pattern in daily time frame. previously few sessions ended up consolidated and retesting inside the channel. As per the technical aspects based on the current price action, the market is expected to continue on bullish trend. The positive rally could be testing all the way up to 3850-3950 level in the upcoming sessions.
crude oil Time Actual Forecast Previous
lnventory
forecast
APl Weekly 3:00 -0.998m …… 2.514m
crude oil stoct Am
Tonight
crude oil 9:00 …… 2.668m 1.263m
inventories Pm
Ela Weekly 9:00 ……. -1.142m -2.257m
Distillates Stock Am
Gasoline 9:00 …… 0.826m 0.513m
lnventories Pm
An alternative scenario indicates that if market breaks below a key support holding at 3700 then it might revise the trend to bearish once again. Such break out could possibly test up to 3650-3600 levels. Key resistance holds at 3950.
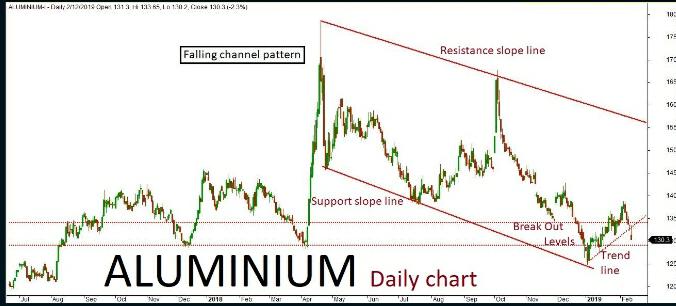
Aluminium daily chart has formed a “Falling channel” pattern. The last few sessions ended up in bearish trend breaking an interim trend line inside the chancel. The market is expected to continue on the bearish trend based on the current price action, once the same breaks below key support holding at 129. The downside rally could be testing all the way through 128-126 levels in the upcoming sessions. ns. Alternatively, if the key support holds strong then the market might retest the same and turn bullish. The upside rally could test up to 132-134 levels. Key resistance holds at 134.
Aluminium Feb Futures
Copper
Technical outlook:
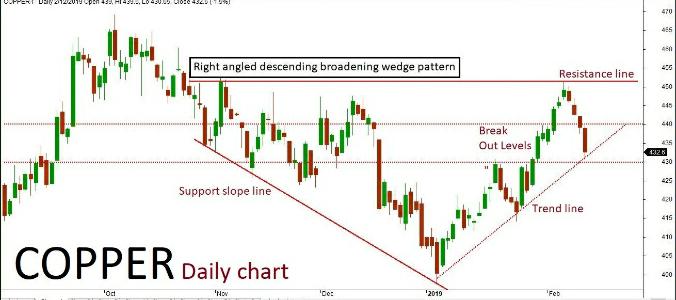
Copper daily chart has formed “Right angled descending broadening wedge” pattern. The last few sessions been in bearish trend along with some corrections inside the channel. The market is expected to continue on bearish momentum based on the current price action, ones the same breaks below a key support holding at 430.The downside rally could be testing all the way through 426-422 levels in the upcoming sessions. Alternatively, if the key support holds strong then the market might retest the same and turn bullish once again. The upside rally could test up to 436-440 levels. Key resistance holds at 440.
Copper Feb Futuces
Lead
Technical outlook
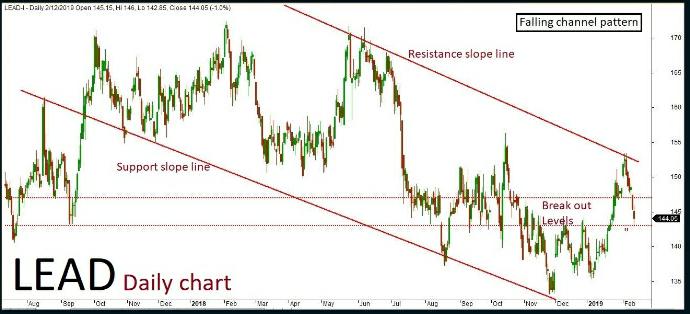
Lead daily chart has formed “Falling channel” pattern. The last few sessions ended up bearish in trend along with some corrections inside the channel. The market is expected to continue on bearish momentum based on the current price action, once the same breaks below a key support holding at 143. The downside rally could be testing all the way up to 142-141 levels in the upcoming sessions. Alternatively, if the key support holds strong then the market might retest the same and turn bullish. The upside rally could test up to 145-147 level. Key resistance holds at 147.
Lead Feb Futures
Nickel
Technical outlook
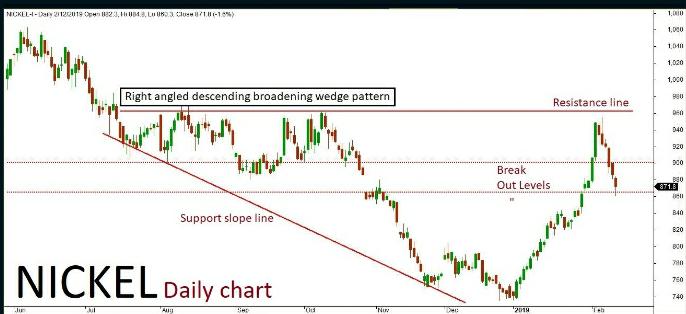
Nickel daily chart has formed “Right-angled Descending broadening wedge” pattern. The last few sessions have been in bearish trend along with some corrections inside the channel. The market is expected to continue on the bearish term based on the current price action, once the same breaks below key support holding at 865. The downside really could be testing all the way through 860-850 levels in the upcoming sessions. Alternatively, if the key support holds strong then the market might retest the same and turn bullish. The upside rally could test up to 885-900 levels. Key resistance holds at 900.
Nickel Feb futures
Zinc
Technical outlook
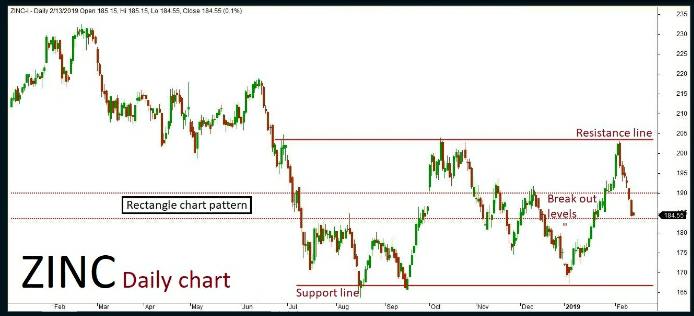
Zinc daily chart has formed “Rectangle chart” pattern. The last session ended up bearish in trend along with some corrections inside the channel. The market is expected to continue on bearish momentum based on the current price action, once the same breaks below a key support holding at 183.50. The downside rally could be testing all the way through 182-180 levels in the upcoming sessions. Alternatively, if the key support holds strong then bullish once again. The upside rally could test up to 188-190 levels. Key resistance holds at 190.
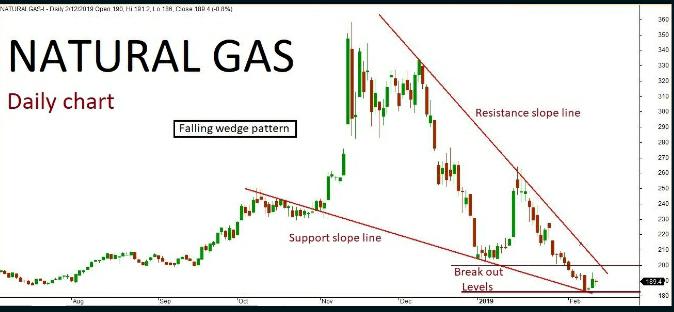
Natural gas daily chart has formed “Falling wedge” pattern. The last few sessions ended up in consolidated retesting near the channel’s support slope line. The market is expected to continue on bullish momentum based on the price action, testing all the way through 195-200 levels in the upcoming sessions. Alternatively, if the market breaks below a key support holding at 183 then in might turn bearish once again. The downside rally could test up to 175 level. Key resistance holds at 200.
Recent Comments