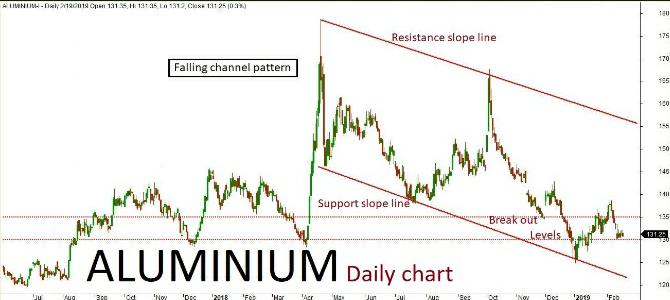
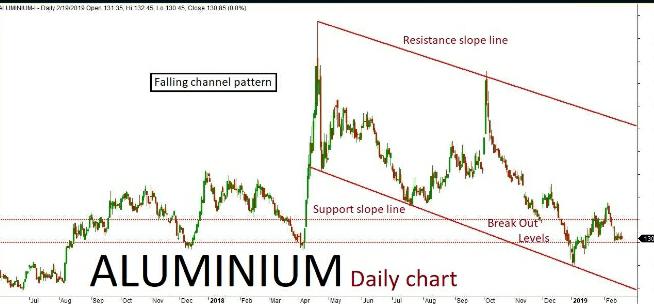
Aluminium daily chart has formed “Falling channel” pattern. The last session ended up in bearish trend after few positive rallies inside the channel. The market is expected to continue on the bearish trend based on the current price action, testing all the way through 132-130 levels in the upcoming sessions. Alternatively, if the market breaks above a key resistance holding at 135 then it might turn bullish once again. The upside rally could test up t 136-138 levels. Key support holds at 130.
Aluminium Feb Futures
Copper
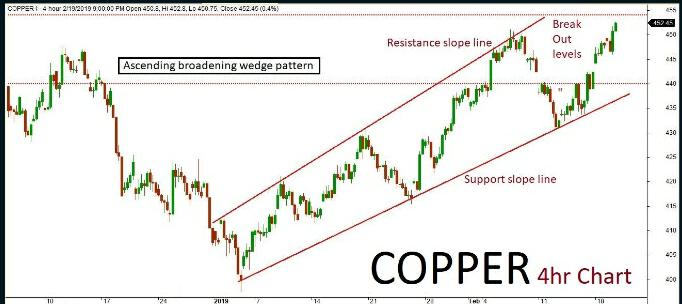
Copper 4hr chart formed “Ascending broadening wedge” pattern. The last session been in bearish trend but also consolidated after few positive rallies inside the channel. The market is expected to continue on bearish momentum based on the on the current price action, once the same breaks below a key support holding at 458. The downside rally could be testing all the way through 454-450 levels in the upcoming sessions. Alternatively, ih the key support holds strong then the market might retest the same and turn bullish once again. The upside rally could test up to 466 level. Key resistance holds at 466.
Copper Feb Futures
Lead
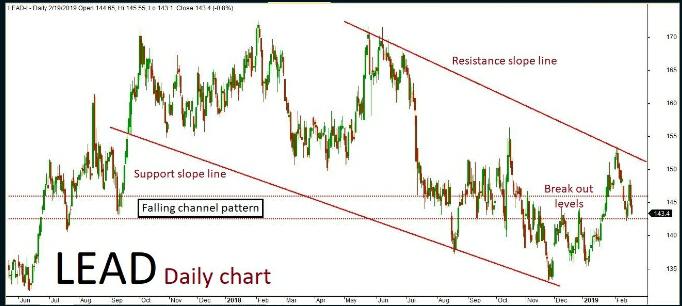
Lead daily chart has formed “Falling channel” pattern. The last few sessions ended up bullish in trend along with some corrections inside the channel. The market is expected to continue on bullish momentum based on the current price action, once the same breaks above a key resistance holding at 148. The upside rally could be testing all the way up to 149-150 levels in the upcoming sessions. Alternatively, if the key resistance holds strong then the market might retest the same and turn bearish once again. The downside rally could test up to 146-144 level. Key support holds at 144.
Lead Feb Futures
Nickel
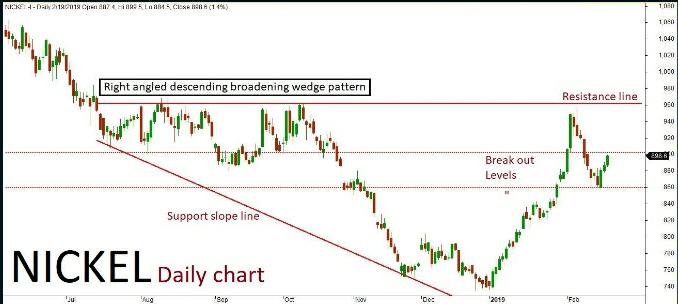
Nickel daily chart has formed “Right angled Descending broadening wedge” pattern. The last sessions been in bearish trend after few positive rallies inside the channel. The market is expected to continue on the bearish term based on the current price action, once the same breaks below a key support holding at 908. The downside rally could be testing all the way through 900-890 levels in the upcoming sessions. Alternatively, if the key support holds strong then the market might retest the same and turn bullish once again. The upside rally could test up to 930-940 levels. Key resistance holds at 940.
Nickel Feb Futures
Zinc
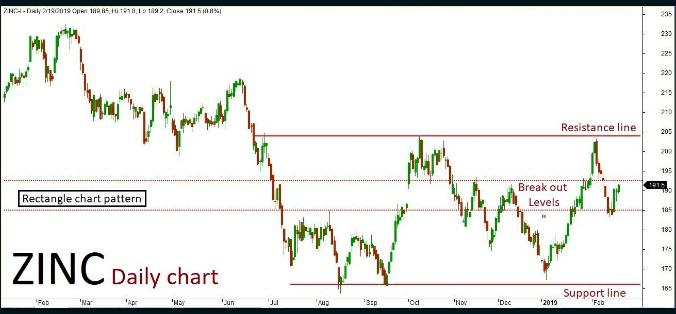
Zinc daily chart has formed “Rectangle chart” pattern. The last session ended up bearish in trend after few positive rallies inside the channel. The market is expected to continue on bearish momentum based on the current price action, once the same breaks below a key support holding at 192. The downside rally could be testing all the way through 190-189 levels in the upcoming sessions. Alternatively, if the key support holds strong then the market might retest the same and turn bullish once again. The upside rally could test up to 196-198 levels. Key resistance holds at 198.
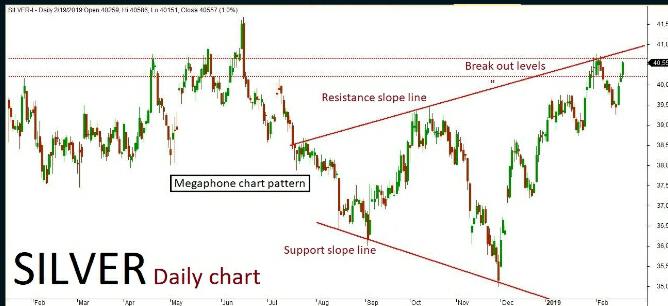
MCX Silver March futures technical chart has taken the formation of “Megaphone chart” pattern in daily time frame. Last few sessions ended up in bearish trend along with some corrections inside the channel, where the market is expected to continue on the trend. The continuation of the trend will be confirmed once the price breaks below a key support holds holding at 39900. The negative rally could be extending all the way up to 39800-39600 levels in the upcoming sessions. An alternative scenario indicates that if the key support holds strong then the market might have a chance to retest the same and revise the trend to bullish once again. The upside rally could test up to 40350 level. Key resistance at 40350.
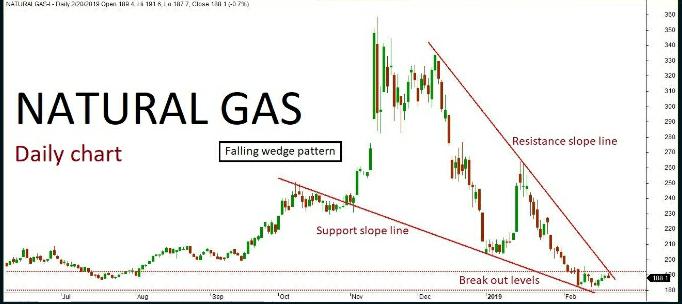
Natural gas daily chart has formed “Falling wedge” pattern. The last few sessions ended up in bullish trend retesting near the channel’s resistance slope line. The market is expected to continue on bullish momentum based on the price action, once the same breaks above a key resistance holding at 200. The upside rally could be testing all the way through 205-210 levels in the upcoming sessions. Alternatively, if the key resistance holds strong then the market might retest the same and turn bearish. The downside rally could test up to 190-185 level. Key support holds at 185.
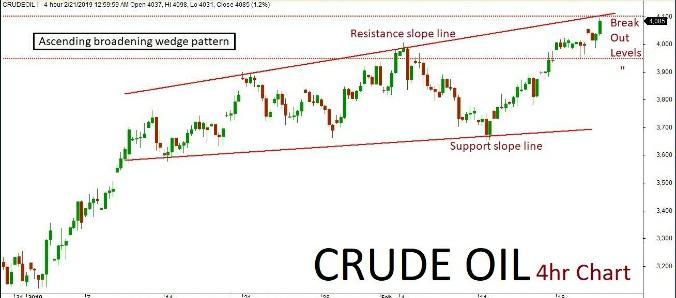
MCX Crude Oil futures technical chart has taken the formation of “Ascending broadening wedge” pattern in 4-hours’ time frame. Previous session ended up bearish in trend after retesting slope line. As per the technical aspects based on the current price action, the market is expected to continue on bearish trend. The continuation of the trend will be confirmed once the price breaks below a key support holding at 3900. The negative rally could be testing all the way up to 3850-3800 level in the upcoming sessions. An alternative scenario indicates that if the key support holds strong then the market might have a chance to retest the same and revise the trend to bullish once again. Such reversal could positive test up to 4020-4100 level. Key resistance holds at 4100.
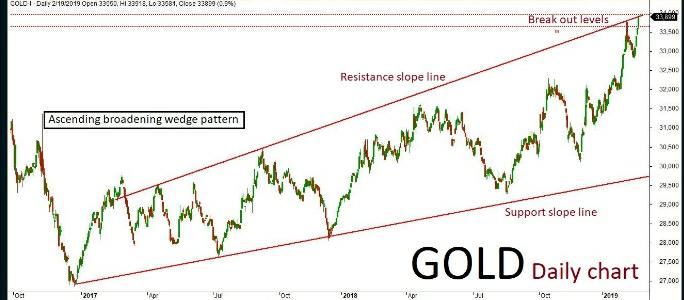
MCX Gold April futures technical chart has taken the formation of “Ascending broadening wedge” pattern in daily time frame. Last few sessions ended up bearish in trend along with some corrections inside the channel, where the market is expected to continue on bearish momentum. The continuation of the trend will be confirmed once the prices breaks below a key support holding at 33330. The negative rally could be extending all the way up to 33200-33100 levels in the upcoming sessions. An alternative scenario indicates that if the key support holds strong then the market might have a chance to retest the same and revise the trend to bullish once again. The upside rally could test up to 33450-33600 levels. Key resistance holds at 33600.
Aluminium daily chart has formed “Falling channel” pattern. The last few sessions ended up in bullish trend along with some corrections inside the channel. The market is expected to continue on the bullish trend based on the current price action, once the same breaks above a key resistance holding at 135.50. The upside rally could be testing all the way through 137-139 levels in the upcoming sessions. Alternatively, if the key resistance holds strong then the market might retest the same and turn bearish. The downside rally could test up to 132-130 levels. Key support holds at 130.
Aluminium Feb Futures
Copper
Copper 4hr chart has formed “Ascending broadening wedge” pattern. The last few sessions been in bullish trend but also consolidated near the channel’s support slope line. The market is expected to continue on bullish momentum based on the current price action, once the same breaks above a key resistance holding at 464. The upside rally could be testing all the way through 468-452 levels in the upcoming sessions. Alternatively, if the key resistance holds strong then the market might retest the same and turn bearish once again. The downside rally
Copper Feb Futures
Lead
Lead daily chart has formed “Falling channel” pattern. The lat session ended up bearish in trend after few positive rallies inside the channel. The market is expected to continue on bearish momentum based on the current price action, testing all the way up to 144.50-143 levels in the upcoming sessions. Alternatively, if the market breaks above a key resistance holding at 147 then it might turn bullish once again. The upside rally could test up to 148-149 level. Key support holds at 143.
Lead Feb Futures
Nickel
Nickel daily chart has formed “Right angled Descending broadening wedge” pattern. The last few sessions been in bullish trend along with some corrections inside the channel. The market is expected to continue on the bullish tern based on the current price action, once the same breaks above a key resistance holding at 922. The upside rally could be testing all the way through 930-940 levels in the upcoming sessions. Alternatively, if the key resistance holds strong then the market might retest the same and turn bearish once again. The downside rally could test up to 900-890 levels. Key support holds at 890.
Nickel Feb Futures
Zinc
Zinc daily chart formed “Rectangle chart” pattern. The last few sessions ended up bullish in trend along with some corrections inside the channel. The market is expected to continue on bullish momentum based on the current price action, once the same breaks above a key resistance holding at 195.50. The upside rally could be testing all the way through 197-199 levels in the upcoming sessions. Alternatively, if the key resistance holds strong then the market might retest the same and turn bearish once again. The downside rally could test up to 192-190 levels. Key support holds at 190


Recent Comments