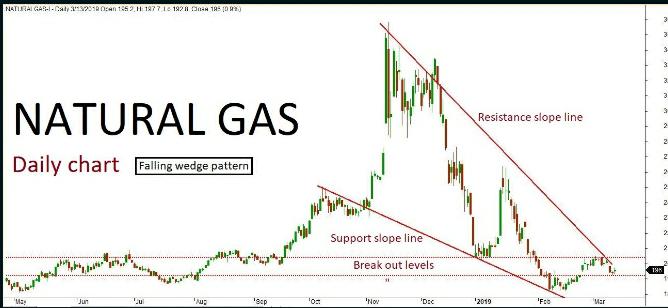
Natural gas daily chart has formed “Falling wedge” pattern. The last few sessions ended up in sideways trend along with some corrections inside the channel. The market is expected to continue on bullish momentum based on the price action, once the same breaks above a key resistance holding at 200. The upside rally could be testing all the way through 204-210 levels in the upcoming sessions. Alternatively, if the key resistance holds strong then the market might retest the same and turn bearish. The downside rally could test up to 190-185 level. Key support holds at 185.
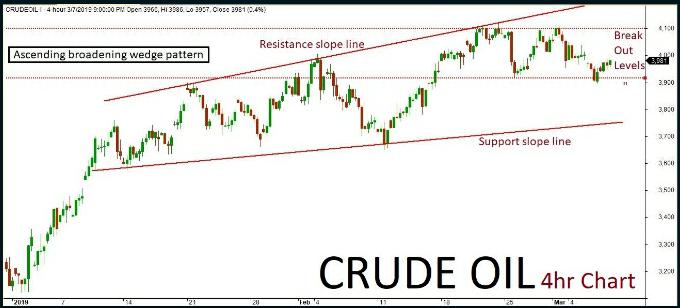
MCX Crude Oil futures technical chart has taken the formation of “Ascending broadening wedge” pattern in 4-hours’ time frame. Previously few sessions ended up bullish in trend along with some corrections inside the channel. As per the technical aspects based on the current price action, the market is expected to continue on bullish trend. The continuation of the trend will be confirmed once the price breaks above a key resistance holding at 4080. The positive rally could be testing all the way up to 4150-4200 level in the upcoming sessions. An alternative scenario indicates that if key resistance holds strong then the market might have a chance to retest the same and revise the trend to bearish once again. Such reversal could possibly test up to 3980-3900 level. Key support holds at 3900.
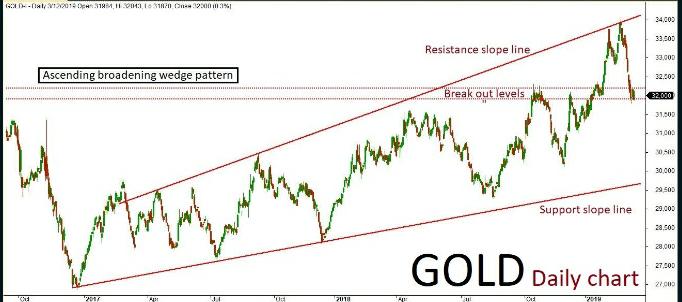
MCX Gold April futures technical chart has taken the formation of “Ascending broadening wedge” pattern in daily time frame. Last session ended up bearish in trend after few consolidations inside the channel, the market is expected to continue on bearish momentum. The continuation of the trend will be confirmed once the price breaks below a key support holding at 31750. The negative rally could be extending all the way up to 31700-31600 levels in the upcoming sessions. An alternative scenario indicates that if the key support holds strong then the market might have a chance to retest the same and revise the trend to bullish once again. The upside rally could test up to 32000-32200 levels. Key resistance holds at 32200.
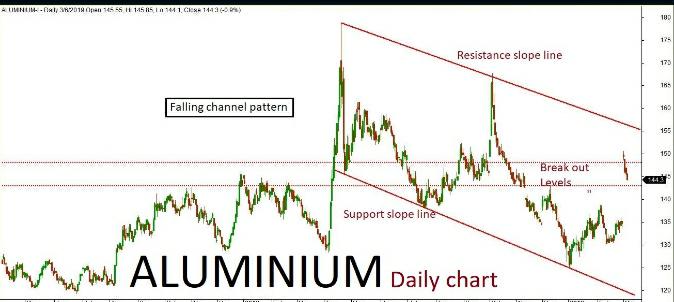
Aluminium daily chart has formed “Falling channel” pattern. The last few sessions ended up in bullish trend along with some corrections inside the channel. The market is expected to continue on the bullish trend based on the current price action, once the same breaks above a key resistance holding at 148. The upside rally could be testing all the way through 150-152 levels in the upcoming sessions. Alternatively, if the key resistance holds strong then the market might retest the same and turn bearish. The downside rally could test up to 146-144 levels. Key support holds at 144.
Aluminium March Futures
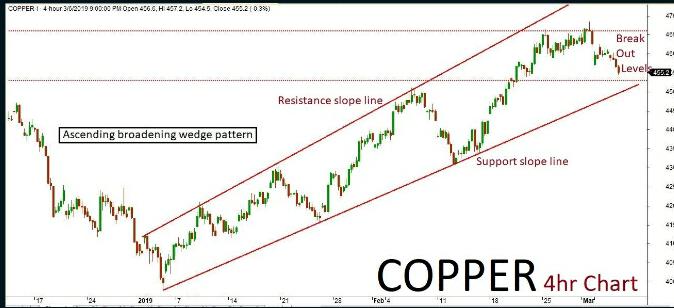
Copper
Copper 4hr chart has formed “Ascending broadening wedge” pattern. The Last few sessions been in consolidation retesting near the channel’s support slope line. The market is expected to continue on bearish momentum based on the current price action, once the same breaks below a key support holding at 450. The downside rally could be testing all the through 445-440 levels in the upcoming sessions. Alternatively, if the key support holds strong then the market might retest the same and turn bullish. The downside rally could test up to 146-144 levels. Key support holds at 144.
Copper March Futures
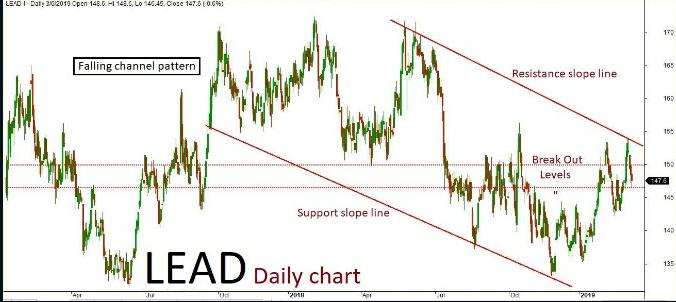
Lead
Lead daily chart has formed “Falling channel” pattern. The last session ended up bullish in trend along with some corrections inside the channel. The market is expected to continue on bullish momentum based on the current price action, once the same breaks above a key resistance holding at 148. The upside rally could be testing all the way up to 149-150 levels in the upcoming sessions. Alternatively, if the key resistance holds strong then the market might retest the same and turn bearish once again. The downside rally could test up to 146-145 level. Key support holds at 145.
Lead March Futures
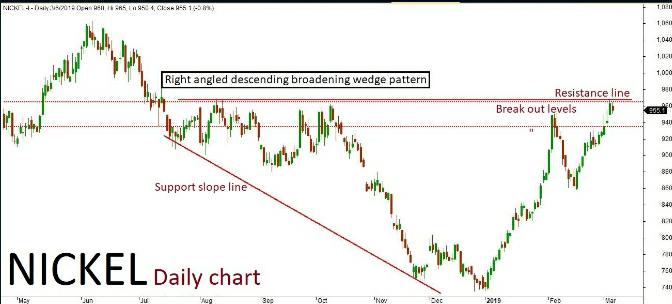
Nickel
Nickel daily chart has formed “Right angled Descending broadening wedge” pattern. The last few sessions been in sideways trend along with some corrections inside the channel. The market is expected to continue on the bearish term based on the current price action, testing all the way through 900-890 levels in the upcoming sessions. Alternatively, if the market breaks above a key resistance holding at 920 then it might turn bullish once again. The upside rally could test up to 930-940 level. Key support holds at 890.
Nickel March Futures
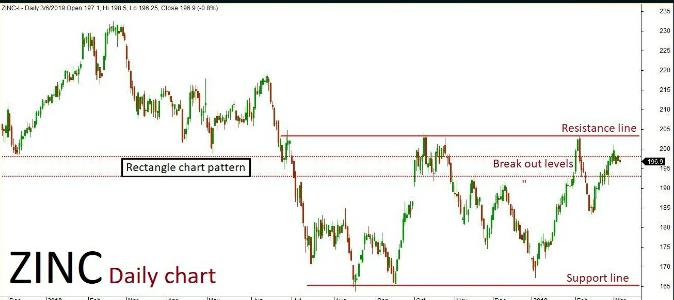
Zinc
Zinc daily chart has formed “Rectangle chart” pattern. The last sessions ended up in bearish trend after few positive rallies inside the channel. The market is expected to continue on bearish momentum based on the current price action, testing all the way through 197-195 levels in the upcoming sessions. Alternatively, if the market breaks above a key resistance holding at 201 then it might turn bullish once again. The upside rally could test up to 202-204 levels. Key support holds at 195.
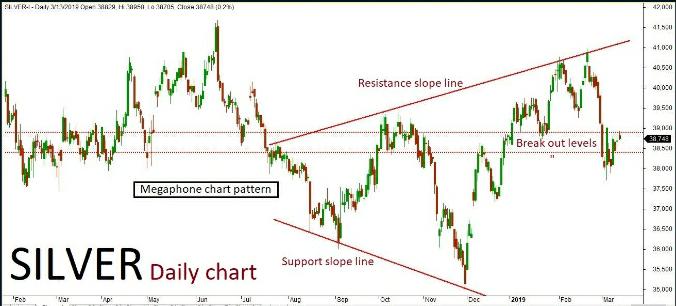
MCX Silver May futures technical chart has taken the formation of “Megaphone chart” pattern in daily time frame. Last few sessions ended up in sideways trend along with some corrections inside the channel, where the market is expected to continue on the bearish trend. The negative rally could be extending all the way up to 38600-38400 levels in the upcoming session. An alternative scenario indicates that if the market breaks above a key resistance holding at 38900 then it might revise the to bullish once again. The upside rally could test up to 39100-39300 level. Key support holds at 38400.
Natural gas daily chart has formed “Falling wedge” pattern. The last few sessions ended up in sideways trend along with some corrections inside the channel. The market is expected to continue on bullish momentum based on the price action, testing all the way through 200-204 levels in the upcoming sessions. Alternatively, if the market breaks below a key support holding at 192 then it might turn bearish once again. The downside rally could test up to 188-184 level. Key resistance holds at 204.

Recent Comments