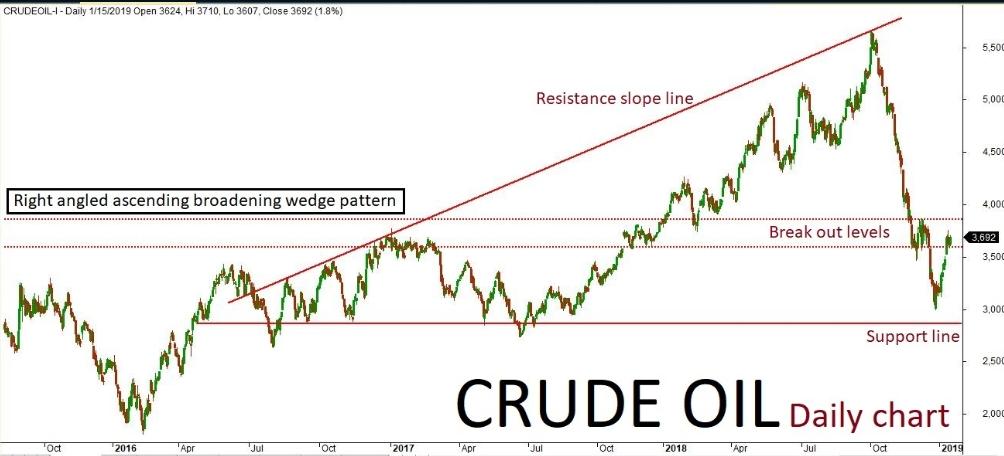
MCX Crude Oil futures technical chart is showing a “Right Angled Ascending Broadening Wedge” patter, while picking a daily time frame. Previous few sessions ended up in a bullish trend along with some inside channel corrections.
As per the technical aspects based on the current price action, the market is expected to continue on a bullish trend. The positive rally could test 3760-3860 levels in upcoming sessions. Key resistance holds at 3860.
An alternative scenario indicated that if markets break below 3600, which is a key support then the trend could be revised to bearish once again. Such a break could possibly break up to 3500-3400 levels.
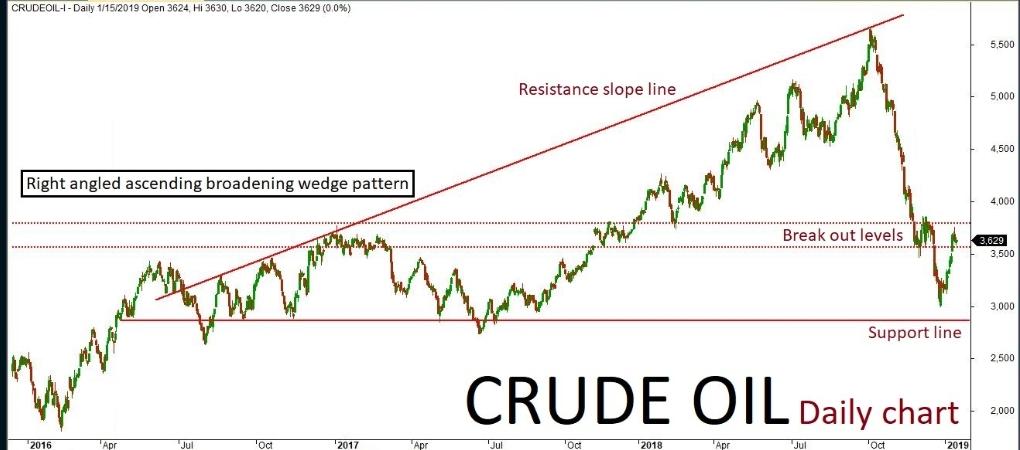
MCX CrudeOil Futures technical chart has taken the formation of “Right Angled Ascending broadening wedge” pattern in the daily time frame. Previously few sessions ended up in bullish trend along with some corrections in the channel.
As per the technical aspects based on the current price action, the market is expected to continue on a Bullish trend. The positive rally could be testing all the way upto 3750-3800 levels in the upcoming sessions. Key Resistance holds at 3800.
An alternate scenario indicates that if the market breaks below a key support holding at 3560 then it might revise the trend to bearish once again. Such breakout could possibly test up to 3500-3400 levels.
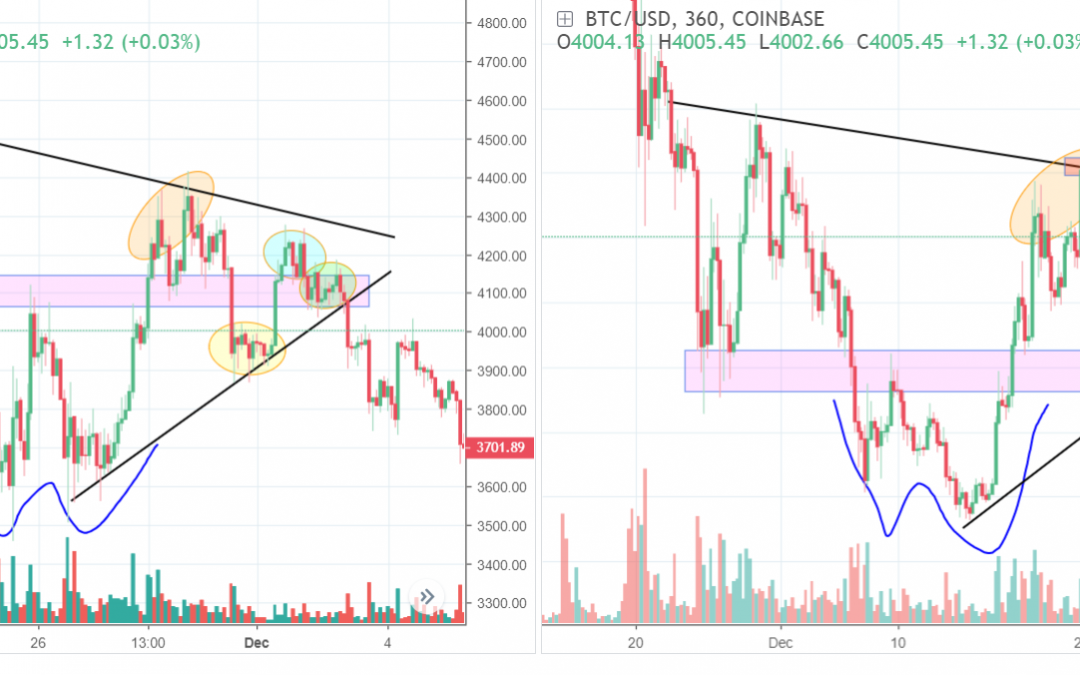
After moving sideways for more than 3 days, after the 300 point squeeze from 3800 to 4100, it looks like me might get our answer for the inverse H&S in the next 24 hours. Based on the consolidation, which has been quite stable above the 4000 (with only wicks below it to 3950ish), we can say the correction has been strong so far. There are some alts that have been moving up in the mean time, which is a bullish sign. But there are 2 of them, ETH’ and XRP’, which are still falling behind. ETH’ has some bearish signs and a lot of resistance above it and XRP’ has been weak as well, not making a decent move up lately. I have been saying, for the bullish version, i want to see XRP’ make a decent move up as well. I posted a chart of xrpbtc’ an hour ago in my channel, where it was bumping against a resistance and minutes later it broke out and made a small jump up. Looking at the USD’ version, it’s also against a big resistance zone now, so all the ingredients are here now for a move up. But even though Bitcoin’ is still holding ground around 4000, there is of course much more needed than just giving support to that level.
When we compare the H&S from a month ago and this one, we can see they look a like. With that one, after we failed to reach the 4500/4600, i said that inverse H&S would most prob fail for several reasons (if you want to know what those reasons were, look up my history).
This inverse H&S , there are some big differences:
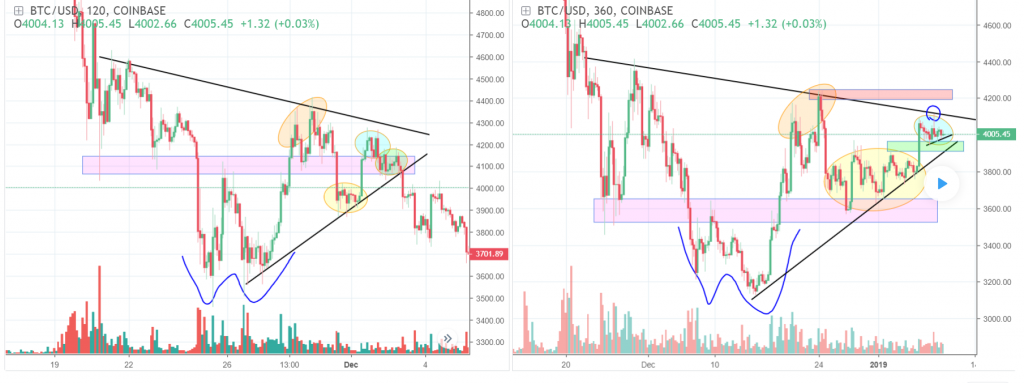
1) Alts look completely different than with the IH&S from November. Most are much higher than in Nov and like XRP’ for example, it had a big bear flag while BTC’ was making the IH&S. So in general, Alts are much stronger and sentiment is more bullish as well. 2) Back then, we made a flash crash from the 6K to the 3500, so the market was of course much more shaky back then, than it is now. This time we have tested the 3K levels much more. 3) The purple zone, is much stronger this time than the previous one. 4) It looks like we are in the blue circle not in the more bearish green circle. 5) Volume from the blue circle now looks higher than it was back then. But the difference is very small though. 6) That blue circle at yesterday’s high. Could mean nothing, could be a sign of the markets intention to break up.
For now, it’s important that Bitcoin’ holds the 4000/3950 level, so alts don’t loose ground and bulls don’t get scared. But knowing how this market works (usually), there is a big chance we might see a shake out to 3800/3850 and bounce back up again. This is likely, because volume is still low which makes it very easy to force such a move. So day trading this is not easy, almost gambling. Moments like these, you need to have your position already and believe in your long or short positions. I was short, my stop would be around 4200 and if i was long my stop would be around 3800. Anything in between is noise, one shake out after the other. The black upwards trend line is also important to watch, of course taking wicks into account, that trend line should not break.
Please don’t forget to comment if you appreciate this 🙂
Recent Comments