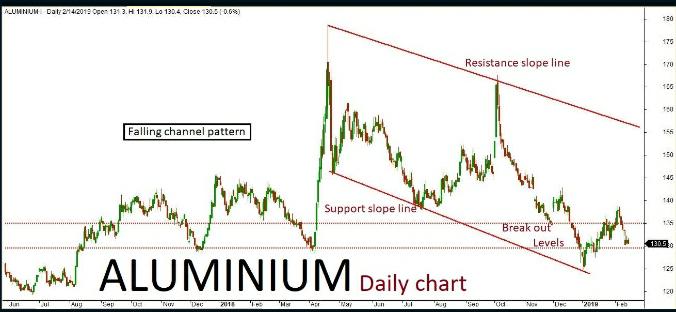
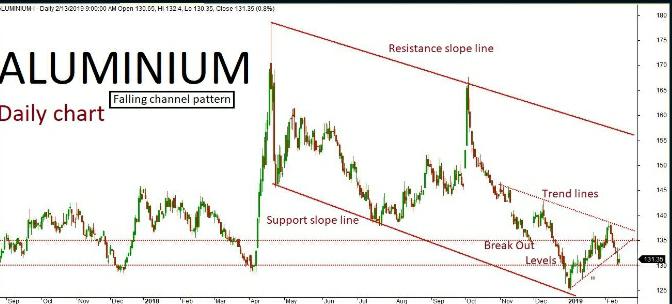
Aluminium daily chart has formed a “Falling channel” pattern. The last few sessions ended up in a bearish trend along with some corrections inside the channel. The market is expected to continue on the bearish trend based on the current price action, once the same breaks below key support holding at 129.50. The downside rally could be testing all the way through 128-127 levels in the upcoming sessions. Alternatively, if key support holds strong then the market might retest the same and turn bullish once again. The upside rally could test up to 133-135 levels. Key resistance holds at 135.
Aluminium Feb Futures
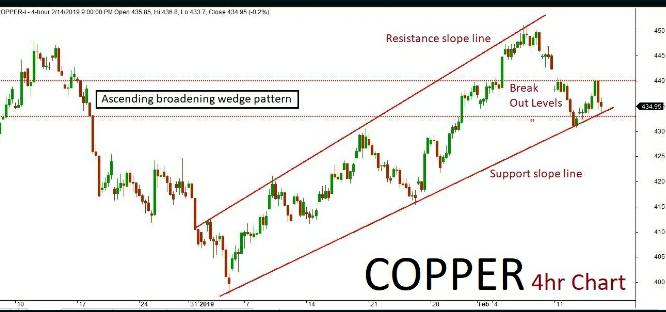
Copper
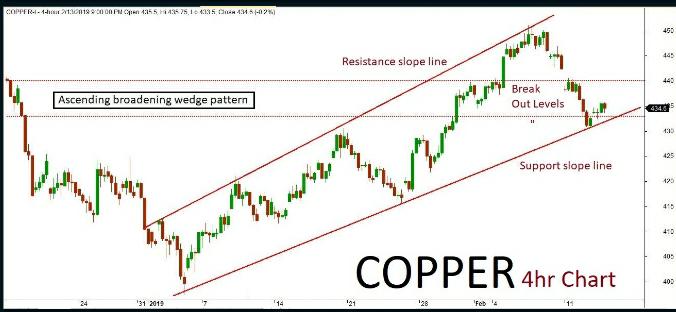
Copper 4hr chart has formed “Ascending broadening wedge” pattern. The last few sessions been in bullish trend but also consolidated near the channel’s support slope line. The market is expected to continue on bullish momentum based on the current price action, testing all the way through 440 and furthermore levels in the upcoming sessions. Alternatively, if the market breaks below key support holding at 433 then it might turn bearish once again. The downside rally could test up to 430-425 levels. Key resistance holds at 440.
Copper Feb Futures
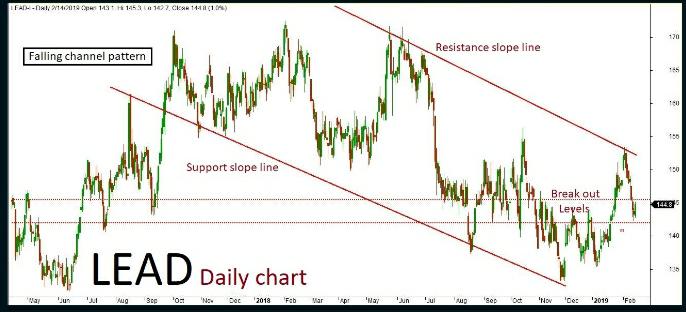
Lead
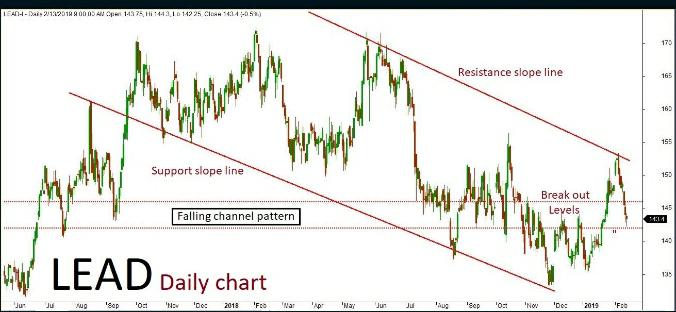
Lead daily chart has formed a “Falling channel” pattern. The last session ended up bullish in trend after a few negative rallies inside the channel. The market is expected to continue on bullish momentum based on the current price action, once the same breaks above a key resistance holding at 145.50. The upside rally could be testing all the way up to 147-148 levels in the upcoming sessions. Alternatively, if the key resistance holds strong then the market might retest the same and turn bearish. The downside rally could test up to 144-142 levels. key support holds at 142.
Lead Feb Futures
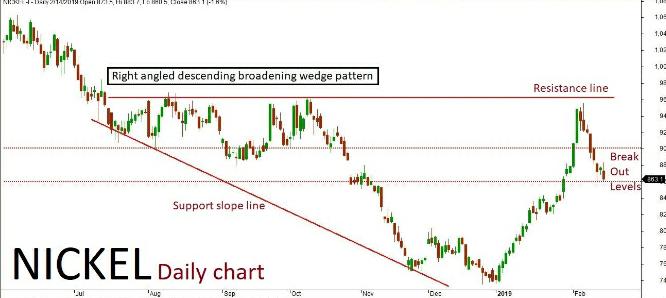
Nickel
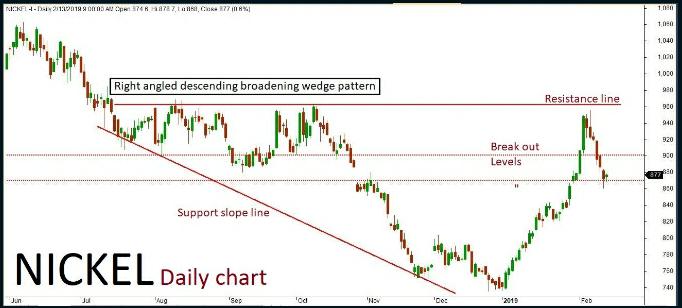
Nickel daily chart has formed “Right-angled Descending broadening wedge” pattern. The last few sessions have been in bearish trend along with some corrections inside the channel. The market is expected to continue on the bearish term based on the current price action, once the same breaks below key support holding at 860. The downside rally could be testing all the way through 850-900 levels in the upcoming sessions. Alternatively, if the key support holds strong then the market might retest the same and turn bullish once again. The upside rally could test up to 880-900 levels. Key resistance holds at 900.
Nickel Feb Futures
Zinc
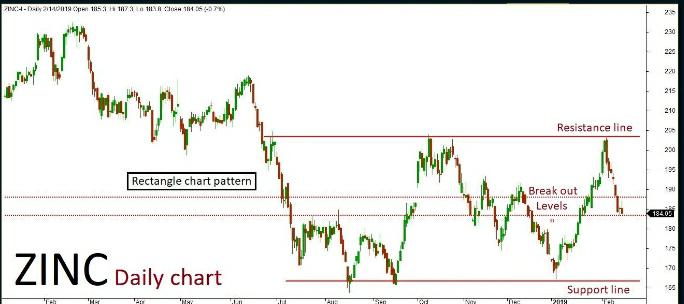
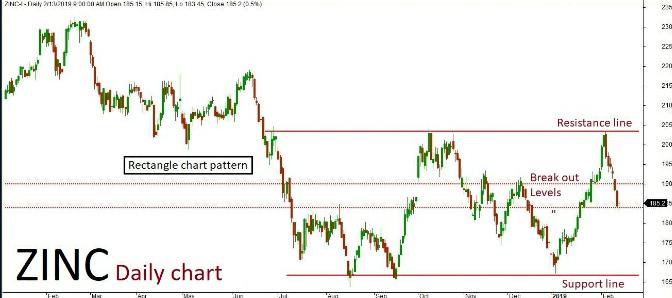
Zinc daily chart has formed “Rectangle chart” pattern. The last few sessions ended up bearish in trend along with some corrections inside the channel. The market is expected to continue on bearish momentum based on the current price action. once the same breaks below a key support holding at 183.50. The downside rally could be testing all the way through 182-180 levels in the upcoming sessions. Alternatively, if the key support holds strong then the market might retest up to 186-188 levels. Key resistance holds at 188.
Aluminium daily chart has formed a “Falling channel” pattern. The last session ended up in bullish trend after few negation rallies inside the channel. The market is expected to continue on the bullish trend based on the current price action, testing all the way through 133-135 levels in the upcoming sessions. Alternatively, if the market breaks below key support holding at 130 then it might turn bearish once again. The downside rally could test up to 128-127 levels. Key resistance holds at 135.
Aluminium Feb Futures
Copper
copper 4hr chart has formed “Ascending broadening wedge” pattern. The last sessions have been in bullish trend after a few negative rallies inside the channel. The market is expected to continue on bullish momentum based on the current price acting, testing all the way through 440 and furthermore levels in the upcoming sessions. Alternatively, if the market breaks below key support holding at 433 then it might turn bearish once again. The downside rally could test up to 430-425 levels. Key resistance holds at 440.
Copper Feb Futures
Lead
Lead daily chart has formed a “Falling channel” pattern. The last few sessions ended up bearish in trend along with some corrections inside the channel. The market is expected to continue on bearish momentum based on the current price acting, once the same breaks below key support holding at 142. The downside rally could be testing all the way up to 141-140 levels in the upcoming sessions. Alternatively, if the key support holds strong then the market might retest the same and turn bullish. The upside rally could test up to 144-146 levels. Key resistance holds at 146.
Lead Feb Futures
Nickel
Nickel daily chart has formed “Right-angled Descending broadening wedge” pattern. The last session been in bullish trend and consolidated after a few negative rallies inside the channel. The market is expected to continue on the bullish term based on the current price action, testing all the way through 890-900 levels in the upcoming sessions. Alternatively, if the market breaks below key support holding at 870 then it might turn bearish once again. The downside rally could test up to 860-850 levels. Key resistance holds at 900.
Nickel Feb Futures
Zinc
Zinc daily chart has formed a “Rectangle chart” pattern. The last session ended up consolidated and retesting after a few negative rallies inside the channel. The market is expected to continue on bullish momentum based on the current price action, testing all the way through 188-190 levels in the upcoming sessions. Alternatively, if the market breaks below key support holding at 184 then it might turn bearish once again. The downside rally could test up to 182-180 levels. Key resistance holds at 190.
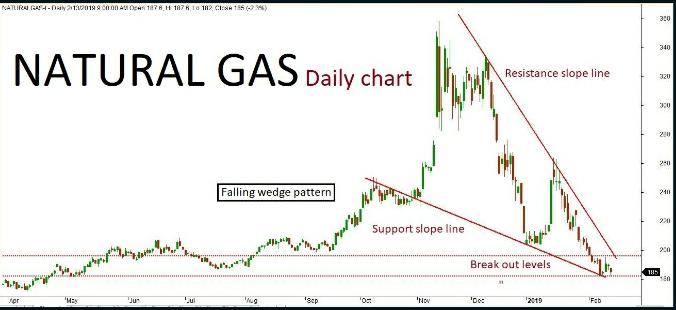
Natural gas daily chart has formed “Falling wedge” pattern. The last few sessions ended up in bearish trend retesting near the channel’s support slope line. The market is expected to continue on bearish momentum based on the price action,once the same breaks below a key support holding at 182. The downside rally could be testing all the way through 198-195 levels in the upcoming sessions. Alternatively, if the key support holds strong then the market might retest the same and turn bullish. The upside rally could test up to 190-196 levels. Key resistance holds at 196.
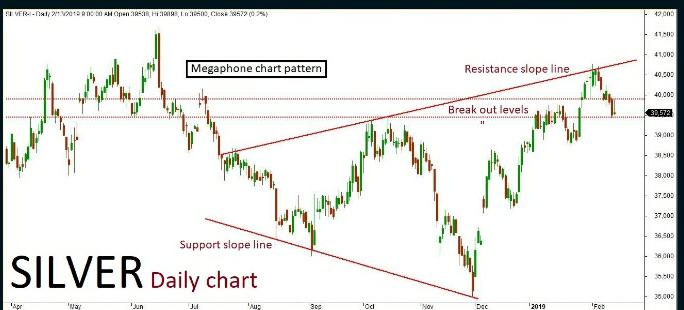
MCX Silver March futures technical chart has taken the formation of “Megaphone chart” pattern in daily time frame. Last session ended up in consolidation and retesting after few negative rallies inside the channel, where the market is expected to continue on the bullish trend. The positive rally could be extending all the way up to 39700-39900 levels in the upcoming sessions. An alternative scenario indicates that if the market breaks below a key support holding at 39450 then it might turn bearish once again. The downside rally could test up to 39300-3910 levels. Key resistance holds at 39900.
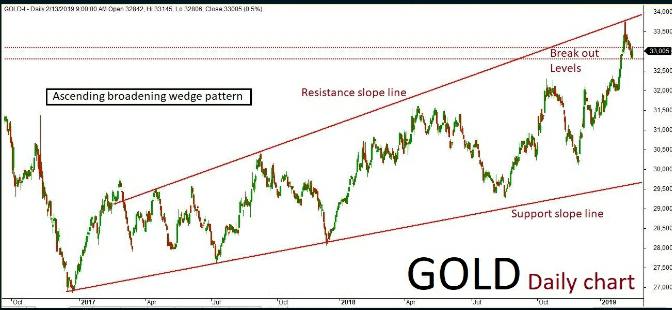
MCX Gold April futures technical chart has taken the formation of “Ascending broadening wedge” pattern in daily time frame. Last session ended up bullish in trend after few negative rallies inside the channel, where the market is expected to continue on bullish momentum. The continuation of the trend will be confirmed once the price breaks above a key resistance holding at 33100. The positive rally could be extending all the way up to 33150-33250 levels in the upcoming sessions. An alternating scenario indicates that if the key resistance holds strong then the market might have a chance to retest the same and revise the trend to bearish once again. The downside rally could test up to 32900-32800 levels. key support holds at 32800.

Recent Comments