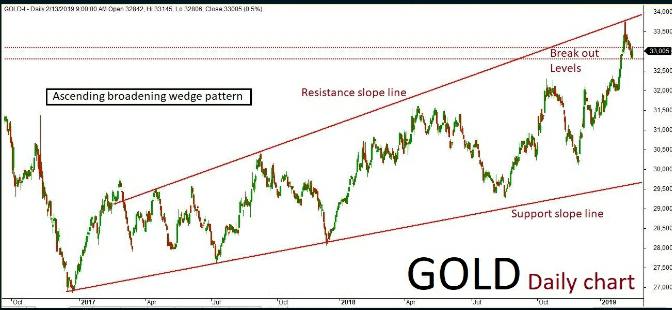
by Rahul Rana | Feb 18, 2019 | Analysis, Market-Watch Staff
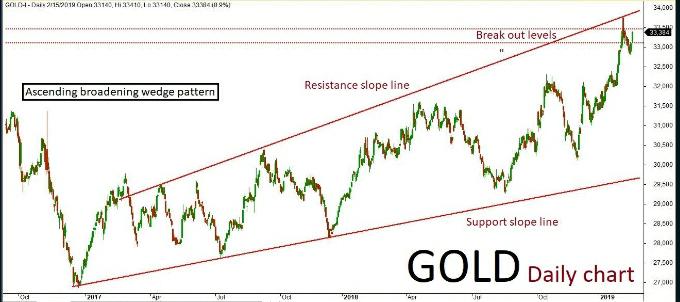
MCX Gold April futures technical chart has taken the formation of “Ascending broadening wedge” pattern in daily time frame. Last few sessions ended up bullish in trend along with some corrections inside the channel, where the market is expected to continue on bullish momentum. The continuation of the trend will be confirmed once the price breaks above a key resistance holding at 33450. The positive rally could be extending all the way up to 33550-33600 levels in the upcoming sessions. An alternative scenario indicates that if the key resistance holds strong then the market might have a chance to retest the same and revise the trend to bearish once again. The downside rally could test up to 33200-33100 levels. Key support holds at 33100.
by Rahul Rana | Feb 18, 2019 | Analysis, Market-Watch Staff
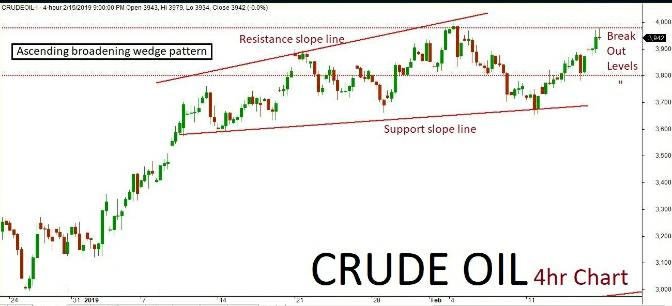
MCX crude oil futures technical chart has taken the formation of “Ascending broadening wedge” pattern in 4-hours’ time frame. Previously few sessions ended up bullish in trend and retesting inside the channel. As per the technical aspects based on the current price action, the market is expected to continue on bullish trend. The continuation of the trend will be confirmed once the price breaks above a key resistance holding at 3980. The positive rally could be testing all the way up to 4080-4150 level in the upcoming sessions. An alternative scenario indicates that if the resistance holds strong then the market might have a chance to retest the same and revise the trend to bearish once again. Such reversal could possibly test up to 3800 level. Key support holds at 3800.
by Rahul Rana | Feb 15, 2019 | Analysis, Market-Watch Staff
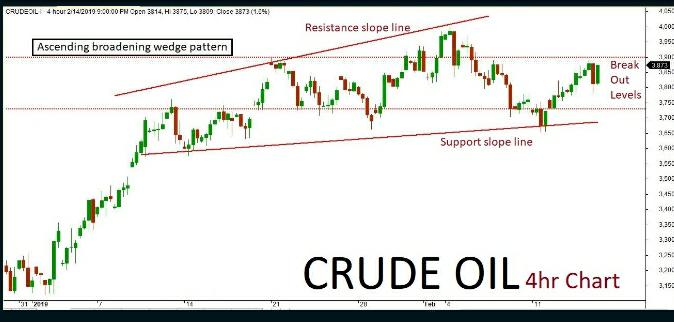
MCX CrudeOil Futures technical chart has taken the formation of “Ascending broadening wedge” pattern in a 4-hours time frame. Previously few sessions ended up bullish in trend and retesting inside the channel. As per the technical aspects based on the current price action, the market is expected to confirm once the prices break above a key resistance holding at 3900. The positive rally could be testing all the way up to 3950-4000 level in the upcoming sessions. An alternative scenario indicates that if key resistance holds strong then the market might have a chance to retest the same and revise the trend to bearish once again. Such reversal could possibly test up to 3800-3730 levels. Key support holds at 3730.
by Rahul Rana | Feb 15, 2019 | Analysis, Market-Watch Staff
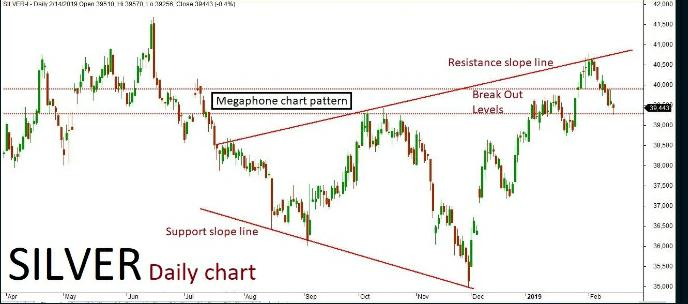
MCX Silver March Futures technical chart has taken the formation of ‘Megaphone Chart’ pattern in a daily time frame. Last few sessions ended up in consolidation and retesting after few negative rallies inside the channel, where the market is expected to continue on the bullish trend. The positive rally could extending all the way up to 39700-39900 levels in the upcoming sessions. An alternative scenario indicates that if the market break below a key support holding at 39300 then it might turn bearish once again. The downside rally could test up to 39150-39000 levels. Key resistance holds at 39900.
by Rahul Rana | Feb 15, 2019 | Analysis, Market-Watch Staff
MCX Gold April futures chart has taken the formation of “Ascending broadening broadening wedge” pattern in daily time frame. Last few sessions ended up bullish in trend along with some corrections inside the channel, where the market is expected to continue on bullish momentum. The continuation of the trend will be confirmed once the price breaks above a key resistance holding at 33150. The positive rally could be extending all the way up to 33300-33400 levels in the coming sessions. An alternative scenario indicates that the key resistance holds strong then the market might have a chance to retest the same and revise the trend to bearish once again. The downside plunging could plummet down to 32950-32800 levels. Key Support holds at 32800.
Recent Comments