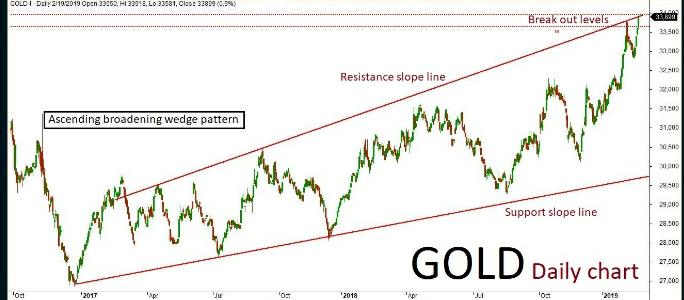
MCX Gold April futures technical chart has taken the formation of “Ascending broadening wedge” pattern in daily time frame. Last sessions ended up bullish in trend after few negative rallies inside the channel, where the market is expected to continue on bullish momentum. The positive rally could be extending all the way up to 33650-33750 levels in the upcoming sessions. An alternative scenario indicates that if the market breaks below a key support holding at 33400 then it might revise the trend to 33300-33750 levels. Key resistance holds at 33750.
All of us are supposed to be planning towards our respective goals in life. We are expected to finish studies in our early 20s, get a job, buy a house by the age of 27, get a car by 29 and so on. Our capacity to dream and aim is unlimited. This needs thorough planning and execution. More than that, it needs money. Not simply earning, but also saving and investments. And to fuel our dreams, we need financial planning.
Act of managing your finances and investments is the basic idea behind financial planning. Making money is not just about earning from a job or multiple sources. It is about effective money management, saving and then investing in the right financial assets to earn more profits. Simply put, you need to make money through investments. This is the only way to roll around in money. Financial planning is the act of managing your income; setting your financial goals and then allocating your assets across investments keeping in mind your limitations and requirements.
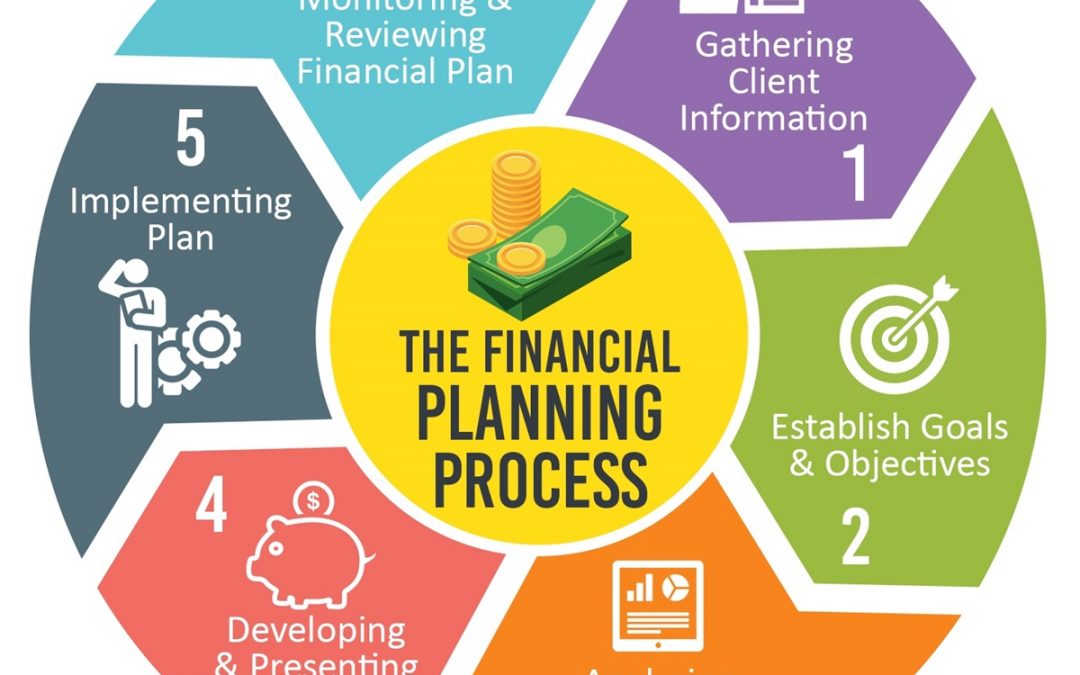
How to Plan Financially?
Set goals -> Prioritize Goals -> Assess Current Situation -> Determine Constraints -> Form Future Strategy.
Importance of Goal Setting: How can you plan a journey without knowing where you’re going? A Goal is the first and most important step in financial and investment planning. This acts as a foundation of all the following parts of the planning process. For this reason, the process of setting your goal is important. Care must be taken that the goals are realistic and achievable.
Goal Prioritization: We rarely have only one thing to achieve in life. While planning your finances, you have to take in consideration all your goals, be it something as large as a Rs 100 crore-retirement allowance or as small as that branded T-shirt you have been eyeing on your way from work. This is why you need to prioritize your goals. They are not equally important, and some need to be achieved first. Efficient prioritization is the key to good planning.
Financial planning is not a simple task. You need to take into account multiple factors about your life – past, present and future – in order to form a feasible financial plan. Remember, for a plan to be effective, it has to be well-thought, comprehensive and with an eye on the future. Simply put, a financial plan has to be planned by individuals keeping in mind their stage in life cycle and their needs. Whoever has money and wants to utilize it in the best possible way, then financial and investment planning is a must. As the old adage goes – If one is failing to plan, they are surely planning to fail. Good and thoughtful planning is the cornerstone of an individual’s good financial health. Not enough can be said about the need for financial planning.
Wealth Management VS. Financial Planning: Wealth management and financial planning are fundamentally similar. However, there is a key difference – you can only manage wealth if you already have it. Financial planning, on the other hand, is even for those who aim to amass wealth.
Dreams and imagination are wonderful, no doubts. But we live in the reality. So, everyone has to understand their current state of life before planning for the future. In simple words, the financial plan is like a bridge connecting your today and future. So your goals and current assessment act as the platform. And you cannot have a strong bridge on rickety bases. For this reason, introspection of your current situation is the starting point to bridge the gap between the present and the future.
What should a financial plan include?
Every financial plan differs. This is because it has to be tailored to suit an individual’s needs and wants. That said, there are some components every plan should cover. While these factors should have precedence, care should be taken than other things that may affect your financial goal should also be covered.
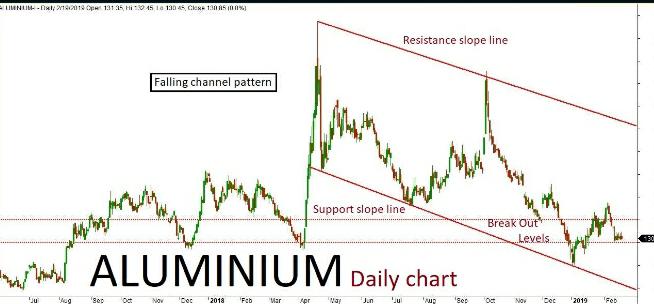
Aluminium daily chart has formed”Falling channel” pattern. The last few sessions ended up in bullish trend along with some corrections inside the channel. The market is expected to continue on the bullish trend based on the current price action, once the same breaks above a key resistance holding at 135.50. The upside rally could be testing all the way through 137-139 levels in the upcoming sessions. Alternatively, if the key resistance holds strong then the market might retest the same and turn bearish. The downside rally could test up to 132-130 levels. Key support holds at 130.
Aluminium Feb Futures
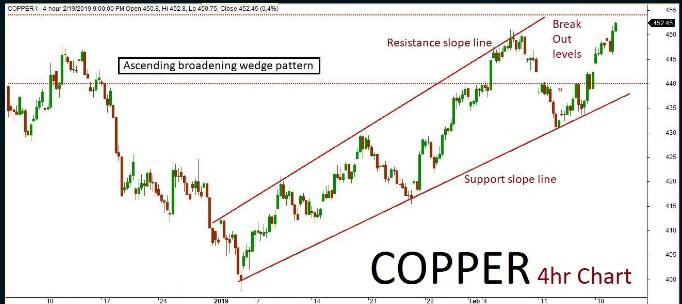
Copper
Copper 4hr chart has formed “Ascending broadening wedge” pattern. The last few sessions been in bullish trend but also consolidated near channel’s support slope line. The market is expected to continue on bullish momentum based on the current price action, once the same breaks above a key resistance holding at 458. The upside rally could be testing all the way through 464-468 levels in the upcoming sessions. Alternatively, if the key resistance holds strong then the market might retest the same and turn bearish once again. The downside rally could test up to 450-445 levels. Key support holds at 445.
Copper Feb Futures
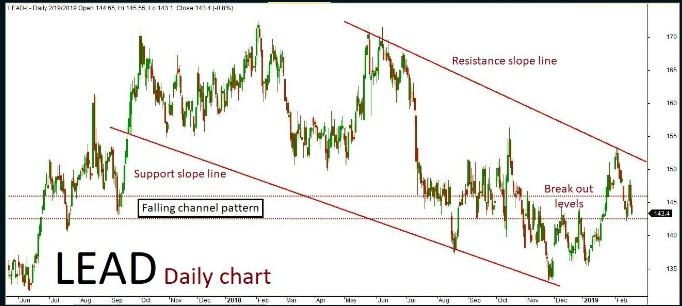
Lead
Lead daily chart has formed “Falling channel” pattern. The last few sessions ended up bullish in trend along with some corrections inside the channel. The market is expected to continue on bullish momentum based on the current price action, once the same breaks above a key resistance holding at 147. The upside rally could be testing all the way up to 148-149 levels in the upcoming sessions. Alternatively, if the resistance holds strong then the market might retest the same and turn bearish once again. The downside rally could test up to 145-143 level. Key support holds at 143.
Lead Feb Futures
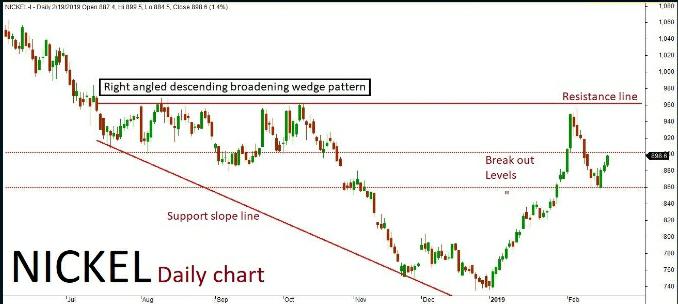
Nickel
Nickel daily chart formed “Right-angled Descending broadening wedge” pattern. The last few sessions have been in bullish trend along with some corrections inside the channel. The market is expected to continue on the bullish term based on the current price action, once the same breaks above a key resistance holding at 916. The upside rally could be testing all the way through 925-930-940 levels in the upcoming sessions. Alternatively, if the resistance holds strong then the market might retest the same and turn bearish once again. The downside really could test up to 900-880 levels. Key support holds at 880.
Nickel Feb Futures
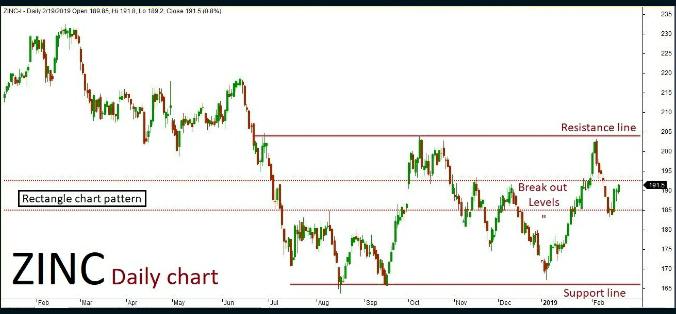
Zinc
Zinc daily chart has formed a “Rectangle chart. pattern. The last session ended up bullish in trend after a few negative rallies inside the channel. the market is expected to continue on bullish momentum based on the current price action, once the same breaks above a key resistance holding at 194. The upside rally could be testing all the way through 196-198 levels in the upcoming sessions. Alternatively, if the key resistance holds strong then the market might retest the same and turn bearish once again. The downside rally could test up to 191-189 levels. Key support holds at 189.
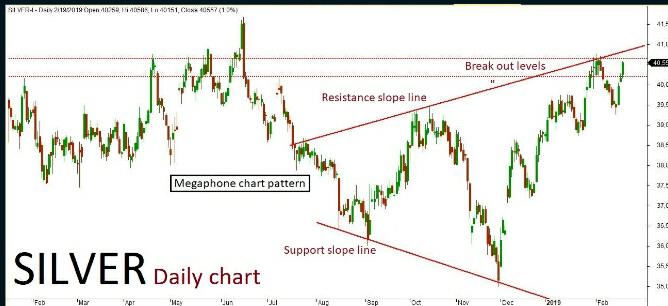
MCX Silver March futures technical chart has taken the formation of “Megaphone chart” pattern in daily time frame. Last session ended up in bearish trend after a long gap down formation inside the channel, where the market is expected to continue on the bearish trend. The continuation of trend will be confirmed once the prices breaks below a key support holding 40,000. The negative rally could be extending all the way up to 39850-39700 levels in the upcoming sessions. An alternative scenario indicates that if the key support holds strong then the market might have a chance to retest the same and revise the trend to bullish once again. The upside rally could test up to 40350-40500 level. Key resistance at 40500.
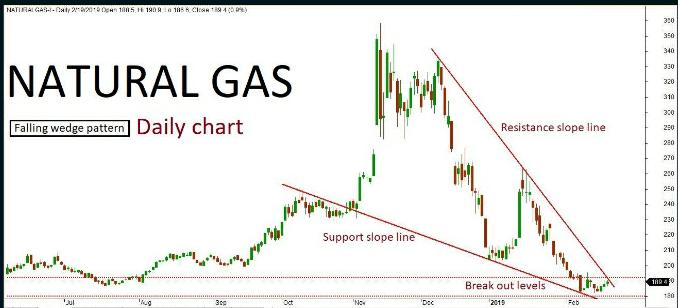
Natural gas daily chart has formed “Falling wedge” pattern. The last few sessions ended up in sideways trend retesting near the channel’s resistance slope line. The market is expected to continue on bullish momentum based on the price action, once the same breaks above a key resistance holding at 195. The upside rally could be testing all the way through 200-210 levels in the upcoming sessions. Alternatively, if the key resistance holds strong then the market might retest the same and turn bearish. The downside rally could test up to 185-180 level. Key support holds at 180.

Recent Comments