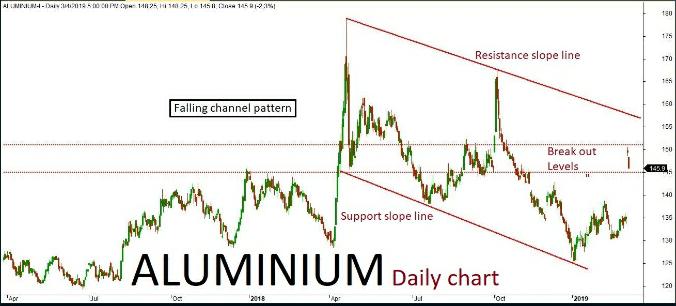
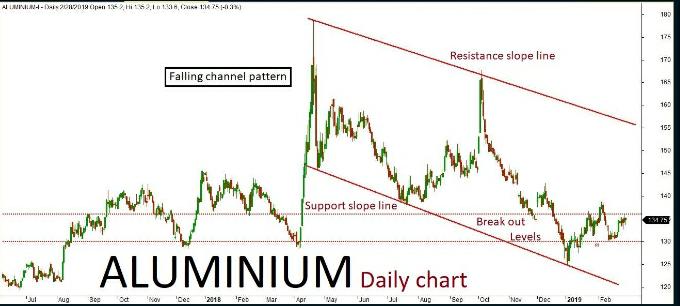
Aluminium daily chart has formed “Falling channel” pattern. The last few sessions ended up in bearish trend after a long gap up formation inside the channel. The market is expected to continue on the bearish trend based on the current price action, once the same breaks below a key support holding at 145. The downside rally could be testing all the way through 144-143 levels in the upcoming sessions. Alternatively, if the key support holds strong then the market might retest the same and turn bullish. he upside rally could test up to 151 level. Key resistance holds at 151.
Aluminium March Futures
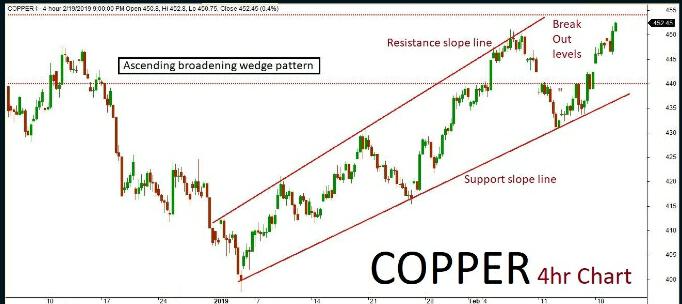
Copper
Copper 4hr chart has formed “Ascending broadening wedge” pattern. The last session been in bullish trend and consolidated on a gap down formation inside the channel. The market is expected to continue on bullish momentum based on the current price action, once the same breaks above a key resistance holding at 460. The upside rally could be testing all the way through 464-468 levels in the upcoming sessions. Alternatively, if the key resistance holds strong then the market might retest the same and turn bearish once again. The downside rally could test up to 453 level. Key support holds at 453.
Copper March Futures
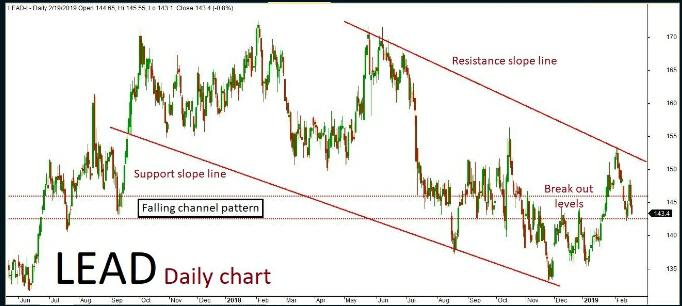
Lead
Lead daily chart has formed “Falling channel” pattern. The last session ended up bearish in trend after few positive rallies inside the channel. The market is expected to continue on bearish momentum based on the current price action, once the same breaks below a key support holding at 149. The downside rally could be testing all the way up to 1488-147 levels in the upcoming sessions. Alternatively, if the key support holds strong then the market might retest the same and turn bullish once again. The upside rally could test up to 151-152 level. Key resistance holds at 152.
Lead March Futures
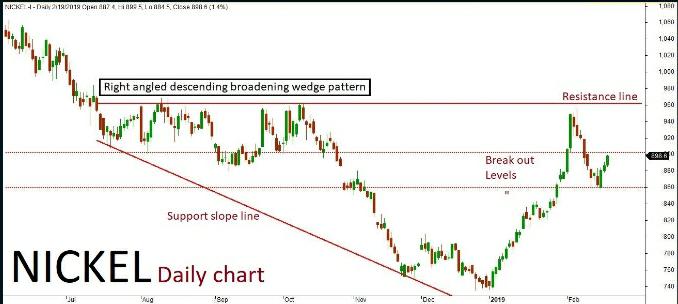
Nickel
Nickel daily chart has formed “Right angled Descending broadening wedge” pattern. The last few sessions been in bullish trend along with some corrections inside the channel. The market is expected to continue on the bullish term based on the current price action, once the same breaks above a key resistance holding at 945. The upside rally could be testing all the way through 950-960 levels in the upcoming sessions. Alternatively, if the key resistance holds strong then the market might retest the same and turn bearish once again. The downside rally could test up to 151 level. Key resistance holds at 151.
Nickel March Futures
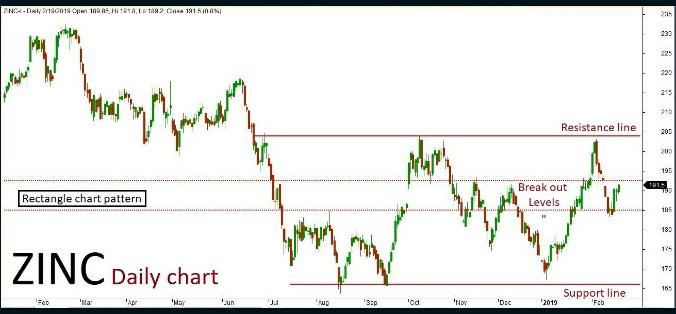
Zinc
Zinc daily chart has formed “Rectangle chart” pattern. The last sessions ended up bearish in trend after few positive rallies inside the channel. The market is expected to continue on bearish momentum based on the current price action, once the same breaks below a key support holding at 195.50. The downside rally could be testing all the way through 194-192 levels in the upcoming sessions. Alternatively, if the key support holds strong then the market might retest the same and turn bullish once again. The upside rally could test up to 199-201 levels. Key resistance holds at 201.
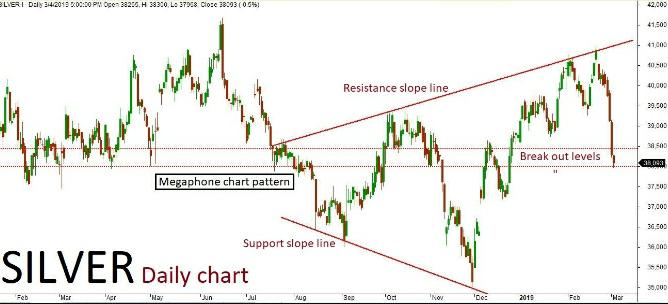
MCX Silver March futures technical chart has taken the formation of “Megaphone chart” pattern in daily time frame. Last few sessions ended up in bearish trend along with some corrections inside the channel, where the market is expected to continue on the bearish trend. The continuation if the trend will be confirmed once the prices breaks below a key support holding at 38000. The negative rally could be extending all the way up to 37900-37700 levels in the upcoming sessions. An alternative scenario indicates that if the key support holds strong then the market might have a chance to retest the same and revise the trend to bullish once again. The upside rally could test up to 38250- 38450 level. Key resistance at 38450.
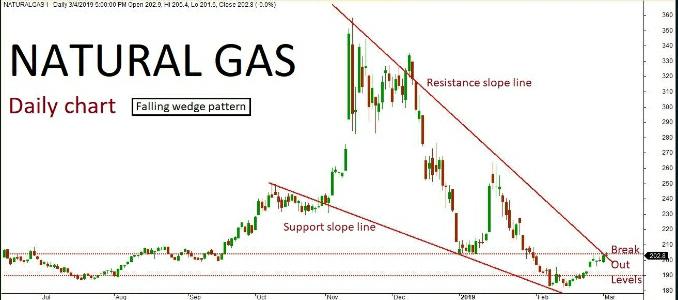
Natural gas daily chart has formed “Falling wedge” pattern. The last few sessions ended up in bullish trend retesting near the channel’s resistance slope line. The market is expected to continue on bullish momentum based on the price action, once the same breaks above a key resistance holding at 204. The upside rally could be testing all the way through 208-212 levels in the upcoming sessions. Alternatively, if the key resistance holds strong then the market might retest the same and turn bearish. The downside rally could test up to 195-190 level. Key support holds at 190.
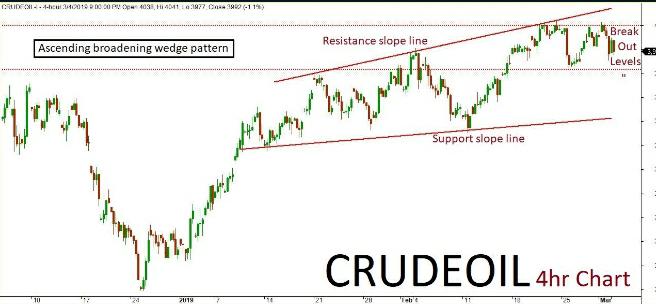
MCX Crude Oil futures technical chart has taken the formation of Ascending broadening wedge” pattern in 4-hours’ time frame. Previously few sessions ended up bearish in trend along with some corrections inside the channel. As per the technical aspects based on the current price action, the market is expected to continue on bearish trend. The continuation of the trend will only be confirmed once the price breaks below a key support holding at 3920. The negative rally could be testing all way up to 3850-3800 level in the upcoming sessions. An alternative scenario indicates that if the key support holds strong then the market might have a chance to retest the same and revise the trend to bullish once again. Such reversal could possibly test up to 4050-4100 level. Key resistance holds at 4100.
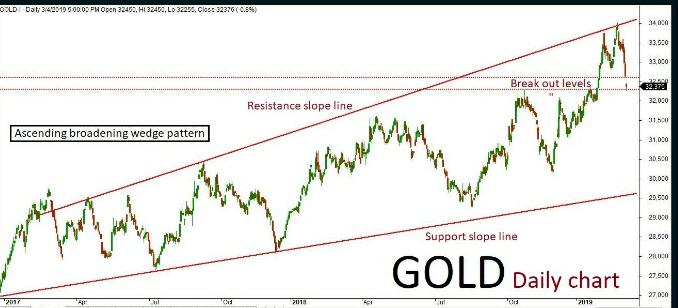
MCX Gold April futures technical chart has taken the formation of “Ascending broadening wedge” pattern in daily time frame. Last few sessions ended up bearish in trend along with some corrections inside the channel, where the market is expected to continue on bearish momentum. The continuation of the trend will be confirmed once the price breaks below a key support holding at 32300. The negative rally could be extending all the way up to 32200-32100 levels in the upcoming sessions. An alternative scenario indicates that if the key support holds strong then the market might have a chance to retest the same and revise the trend to bullish once again. The upside rally could test up to 32450-32600 levels. Key resistance holds at 32600.
Recent Comments