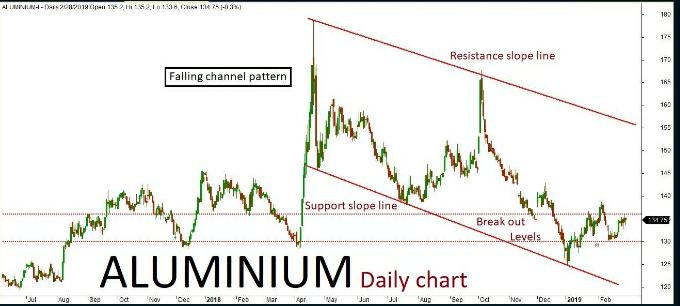
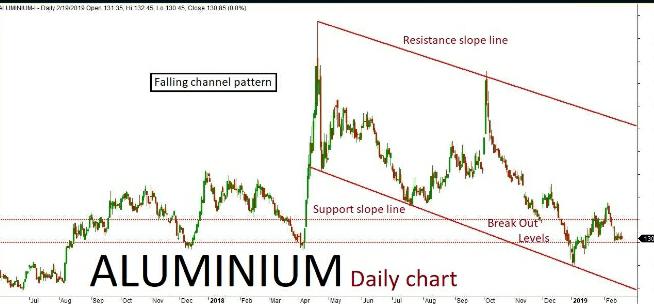
Aluminium daily chart has formed “Falling channel” pattern. The last few sessions ended up in bearish trend after a long gap up formation inside the channel. The market is expected to continue on the bearish trend based on the current price action, once the same breaks below a key support holding at 145. The downside rally could be testing all the way through 144-143 levels in the upcoming sessions. Alternatively, if the key support holds strong then the market might retest the same and turn bullish. The upside rally could test up to 150 level. Key resistance holds at 150.
Aluminium March Futures
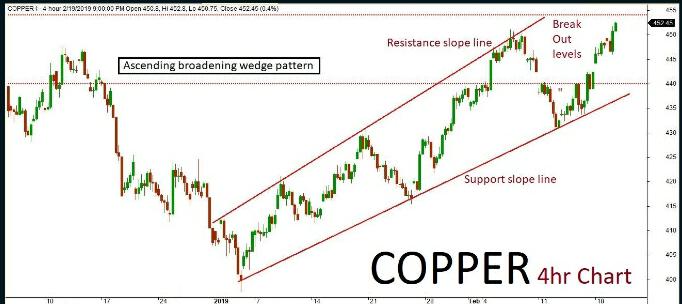
Copper
Copper 4hr chart has formed “Ascending broadening wedge pattern. The last few sessions have been in bearish trend along with some corrections inside the channel. The market is expected to continue on bearish momentum based on the current price action, once the same breaks below key support holding at 458. The downside rally could be testing all the way through 454-450 levels in the upcoming sessions. Alternatively, if the key support holds strong then the market might retest the same and turn bullish once again. The upside rally could test up to 464-468 level. Key resistance holds at 468.
Copper March Futures
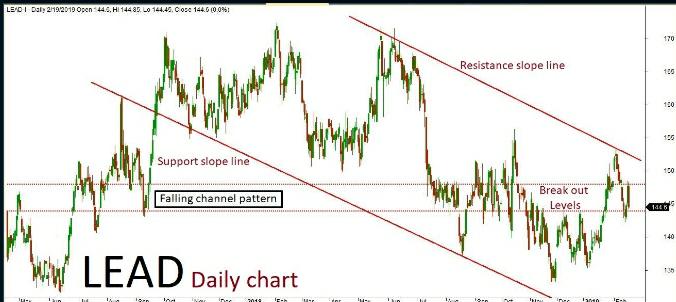
Lead
Lead daily chart has formed a “Falling channel” pattern. The last few sessions ended up bearish in trend along with some corrections inside the channel. The market is expected to continue on bearish momentum based on the current price action, once the same breaks below key support holding at 147.50. The downside rally could be testing all the way through 146-145 levels in the upcoming sessions. Alternatively, if the key support holds strong then the market might retest the same and turn bullish once again. The upside rally could test up to 150-152 level. Key resistance holds at 152.
Lead March Futures
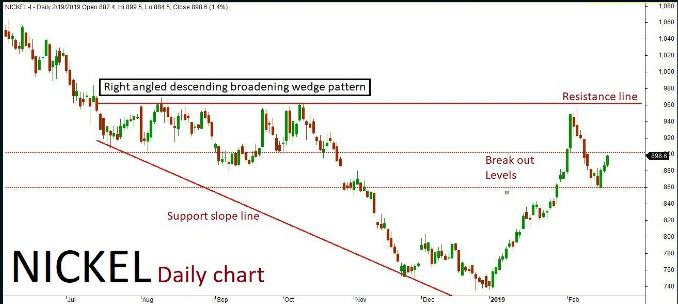
Nickel
Nickel daily chart has formed “Right-angled Descending broadening wedge” pattern. The last few sessions have been in bullish trend along with some corrections inside the channel. The market is expected to continue on the bullish term based on the current price action, once the same breaks above a key resistance holding at 968. The upside rally could be testing all the way through 975-985 levels in the upcoming sessions. Alternatively, if the key resistance holds strong then the market might retest the same and turn bearish once again. The downside rally could test up to 950-935 levels. Key support holds at 935.
Nickel March Futures
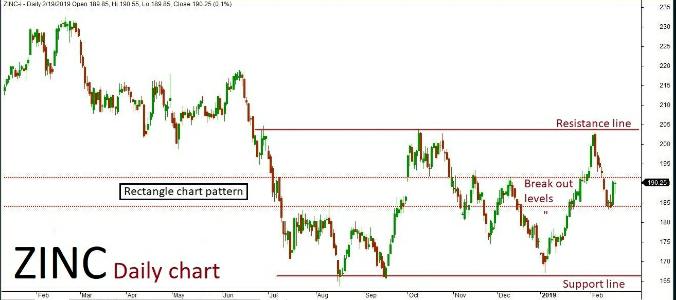
Zinc
Zinc daily chart has formed “Rectangle chart” pattern. The last few sessions ended up bullish in trend along with some corrections inside the channel. The market is expected to continue on bullish momentum based on the current price action, once the same breaks above a key resistance holding at 200. The upside rally could be testing all the way through 201-203 levels in the upcoming sessions. Alternatively, if the key resistance holds strong then the market might retest the same and turn bearish once again. The downside rally could test up to 196-194 levels. Key support holds at 194.
Renault is developing the Duster facelift model to meet the upcoming pedestrian safety standards and the engines will be updated to meet BSVI norms The current generation Renault Duster was launched in 2012 in India and globally the company introduced the sec… Read More
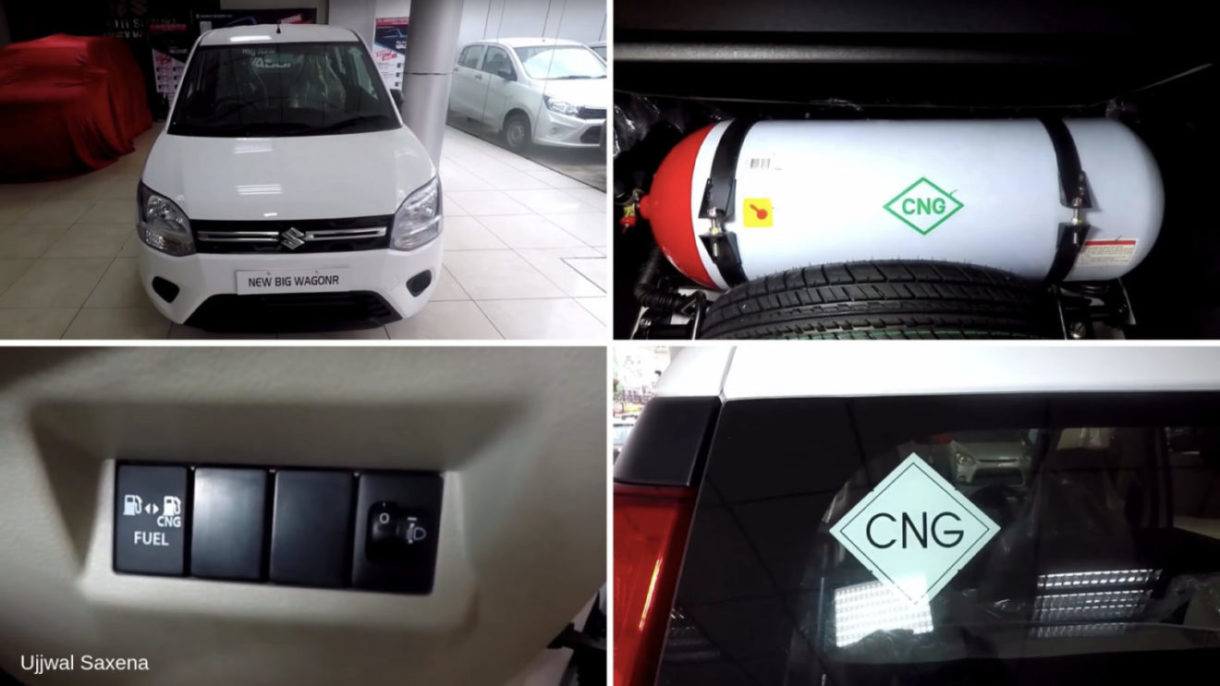
2019 Maruti Wagon R S-CNG is offered in LXi and LXi (O) trims, delivers best-in-class mileage in its segment Maruti Suzuki India Limited (MSIL) introduced the third generation Wagon-R on 23rd January with much anticipation as it has been the biggest upgrade i… Read More
Forbes’ billionaire list: Only two women – L’Oreal Heiress Francoise Bettencourt and Alice Walton, chairman of Crystal Bridges Museum of American Art – could make it to the list. Read More
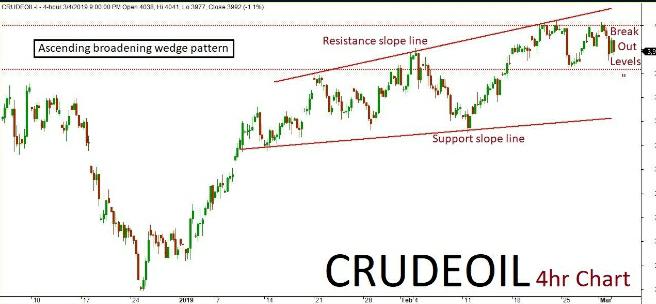
MCX Crude Oil futures technical chart has taken the formation of Ascending broadening wedge” pattern in 4-hours’ time frame. Previously few sessions ended up bearish in trend and consolidated inside the channel. As per the technical aspects based on the current price action, the market is expected to continue on bearish trend. The continuation of the trend will only be confirmed once the prices breaks below a key support holding at 3920. The negative rally could be testing all the way up to 3850-3800 level in the upcoming sessions. An alternative scenario indicates that if the key support holds strong then the market might have a chance to retest the same and revise the trend to bullish once again. Such reversal could possibly test up to 4050-4100 level. Key resistance holds at 4100.


Recent Comments