Even though they may remain volatile in the run-up to the polls as political parties stitch up alliances, the long – term trajectory for the markets remains up, they believe. Read More
reported by Puneet Wadhwa at Business-standard.com
Get all the live updates from the launch of the new 2019 Honda Civic here. The 10th generation Honda Civic comes with new design, styling and for the first time it will be available in both petrol and diesel engines in India. Read More
Maruti Suzuki is working on 6-Seater version of the Ertiga which is expected to sell through the Nexa dealerships Maruti Suzuki India Limited will soon launch the 6-seater version of the Ertiga in the Indian market as we exclusively reported about it a while … Read More
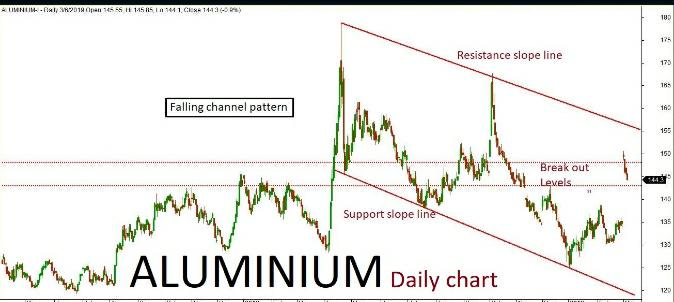
Aluminium daily chart has formed “Falling channel” pattern. The last few sessions ended up in bearish trend after a long gap up formation inside the channel. The market is expected to continue on the bearish trend based on the current price action, once the same breaks below a key support holding at 143. The downside rally could be testing all the way through 142-140 levels in the upcoming sessions,. Alternatively, if the key support holds strong then the market might retest the same and turn bullish. The upside rally could test u to 146-148 levels. Key resistance holds at 148.
Aluminium March Futures
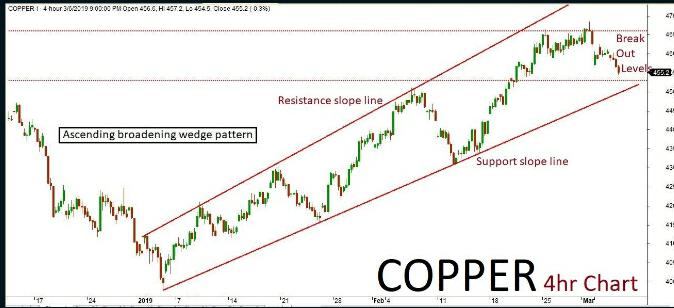
Copper
Copper 4hr chart has formed “Ascending broadening wedge” pattern. The last few session been in bearish trend along with some corrections inside the channel. The market is expected to continue on bearish momentum based on the current price action, once the same breaks below a key support holding at 453. The downside rally could be testing all the way through 450-445 levels in the upcoming sessions. Alternatively, if the key support holds strong then the market might retest the same and turn bullish once again. The upside rally could test up to 460-466 level. Key resistance holds at 466.
Copper March Futures
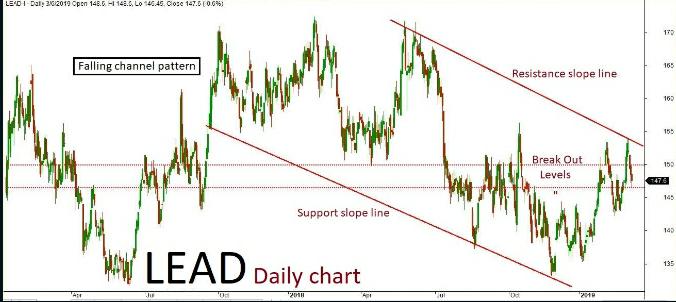
Lead
Lead daily chart has formed “Falling channel” pattern. The last few sessions ended up bearish in trend along with some corrections inside the channel. The market is expected to continue on bearish momentum based on the current price action, once the same breaks below a key support holding at 146.50. The downside rally could be testing all the way up to 145- 144 levels in the upcoming sessions. Alternatively, if the key support holds strong then the market might retest the same and turn bullish once again. The upside rally could test up to 148-150 level. Key resistance holds at 150.
Lead March Futures
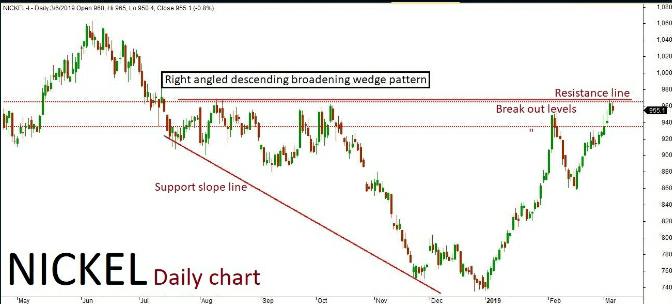
Nickel
Nickel daily chart has formed “Right-angled Descending broadening wedge” pattern. The last sessions have been in a bearish trend after a few positive rallies inside the channel. The market is expected to continue on the bearish term based on the current price action, testing all the way through 945-935 levels in the upcoming sessions. Alternatively, if the market breaks above a key resistance holding at 945 then it might turn bullish once again. The upside rally could test up to 970-980 levels. Key support holds at 935.
Nickel March futures
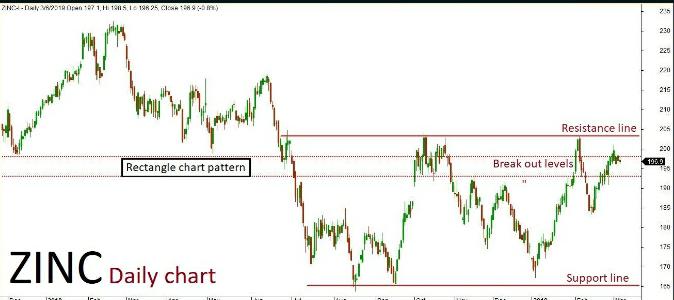
Zinc
Zinc daily chart has formed a “Rectangle chart” pattern. The last few sessions ended up in a sideways trend and also consolidated inside the channel. The market is expected to continue on bearish momentum based on the current price action, testing all the way through 195-193 levels in the upcoming sessions. Alternatively, if the market breaks above a key resistance holding at 198 then it might turn bullish once again. The upside rally could test up to 200-203 levels. Key support holds at 193.


Recent Comments