by abhinav | Mar 13, 2019 | News

India Business News: Twelve Boeing 737 Max of SpiceJet will be grounded by 4 pm Wednesday. “Consequent to the regulatory directive on the Boeing 737 MAX, SpiceJet has alre Read More
reported by Saurabh Sinha at The Times of India
by abhinav | Mar 13, 2019 | News
If the tribunal goes ahead with its threat, the payment to Ericsson will be left in the lurch. Read More
reported by Karunjit Singh at The Times of India

by Rahul Rana | Mar 13, 2019 | Analysis, Market-Watch Staff
MCX Crude Oil futures technical chart has taken the formation of “Ascending broadening wedge” pattern in 4-hours’ time frame. Previously few sessions ended up sideways in trend along with some corrections inside the channel. As per the technical aspects based on the current price action, the market is expected to continue on bullish trend. The continuation of the trend will be confirmed once the prices breaks above a key resistance holding at 4000. The positive rally could be testing all the way up to 4100-4180 level in the upcoming sessions. An alternative scenario indicates that if key resistance holds strong then the market might have a chance to retest the same and revise the trend to bearish once again. Such reversal could possibly test up to 3900-3830 level. Key support holds at 3830.
by Rahul Rana | Mar 13, 2019 | Analysis, Market-Watch Staff
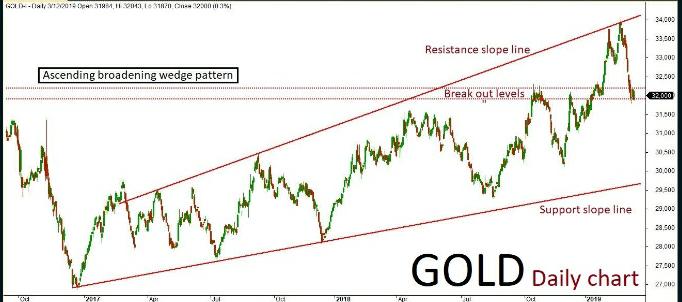
MCX Gold April futures technical chart has taken the formation of “Ascending broadening wedge” pattern in daily time frame. Last few sessions ended up sideways in trend along with some corrections inside the channel, where the market is expected to continue on bullish momentum. The positive rally could be extending all the way up to 32100-32200 levels in the upcoming sessions. An alternative scenario indicates that if the market breaks below a key support holding at 31900 then it might revise the trend to bearish. The downside rally could test up to 31800-31700 levels. Key resistance holds at 32200.
by abhinav | Mar 13, 2019 | News

Brokerage firm had earlier slashed company’s valuation to $550 million Read More
reported by Biswarup Gooptu, Samidha Sharma, ETtech at The Times of India
Recent Comments