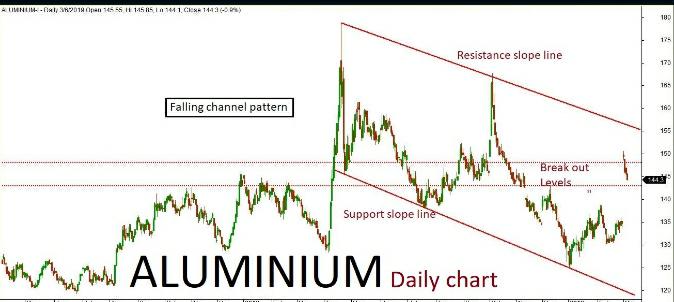
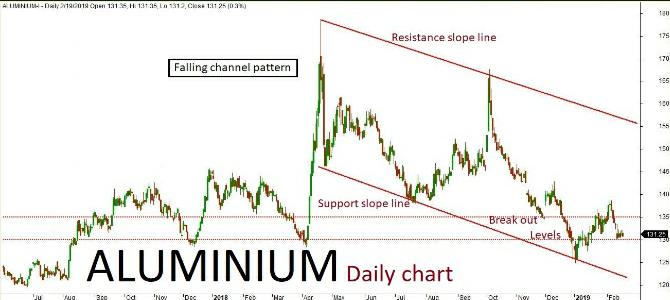
Aluminium daily chart has formed “Falling channel” pattern. The last few sessions ended up in bullish trend along with some corrections inside the channel. The market is expected to continue on the bullish trend based on the current price action, once the same breaks above a key resistance holding at 148. The upside rally could be testing all the way through 150-152 levels in the upcoming sessions. Alternatively, if the key resistance holds strong then the market might retest the same and turn bearish. The downside rally could test up to 146-144 levels. Key support holds at 144.
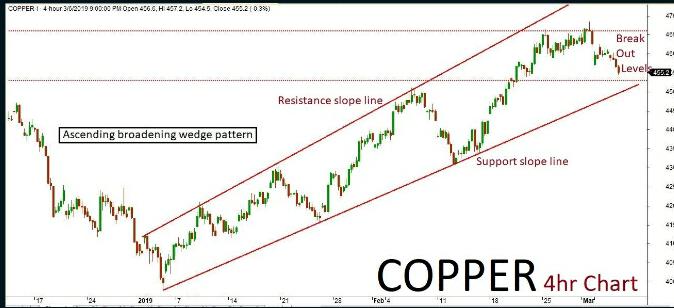
Copper
Copper 4hr chart has formed “Ascending broadening wedge” pattern. The Last few sessions been in consolidation retesting near the channel’s support slope line. The market is expected to continue on bearish momentum based on the current price action, once the same breaks below a key support holding at 450. The downside rally could be testing all the through 445-440 levels in the upcoming sessions. Alternatively, if the key support holds strong then the market might retest the same and turn bullish. The downside rally could test up to 146-144 levels. Key support holds at 144.
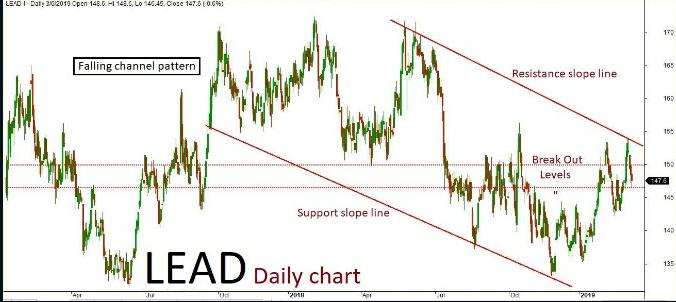
Lead
Lead daily chart has formed “Falling channel” pattern. The last session ended up bullish in trend along with some corrections inside the channel. The market is expected to continue on bullish momentum based on the current price action, once the same breaks above a key resistance holding at 148. The upside rally could be testing all the way up to 149-150 levels in the upcoming sessions. Alternatively, if the key resistance holds strong then the market might retest the same and turn bearish once again. The downside rally could test up to 146-145 level. Key support holds at 145.
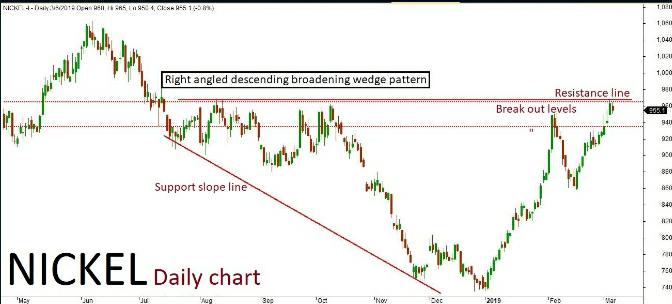
Nickel
Nickel daily chart has formed “Right angled Descending broadening wedge” pattern. The last few sessions been in sideways trend along with some corrections inside the channel. The market is expected to continue on the bearish term based on the current price action, testing all the way through 900-890 levels in the upcoming sessions. Alternatively, if the market breaks above a key resistance holding at 920 then it might turn bullish once again. The upside rally could test up to 930-940 level. Key support holds at 890.
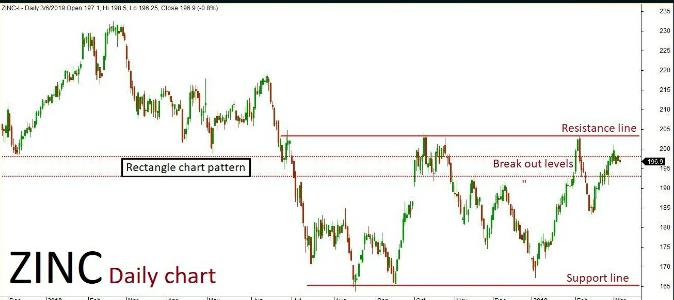
Zinc
Zinc daily chart has formed “Rectangle chart” pattern. The last sessions ended up in bearish trend after few positive rallies inside the channel. The market is expected to continue on bearish momentum based on the current price action, testing all the way through 197-195 levels in the upcoming sessions. Alternatively, if the market breaks above a key resistance holding at 201 then it might turn bullish once again. The upside rally could test up to 202-204 levels. Key support holds at 195.
Recent Comments