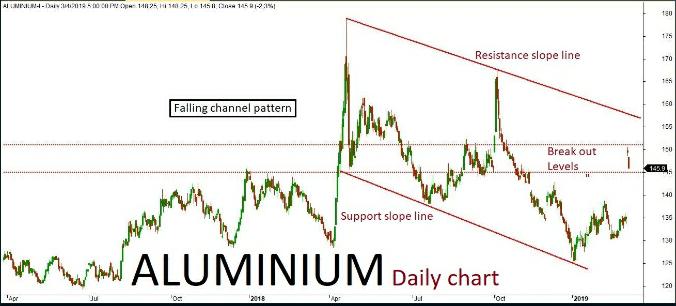
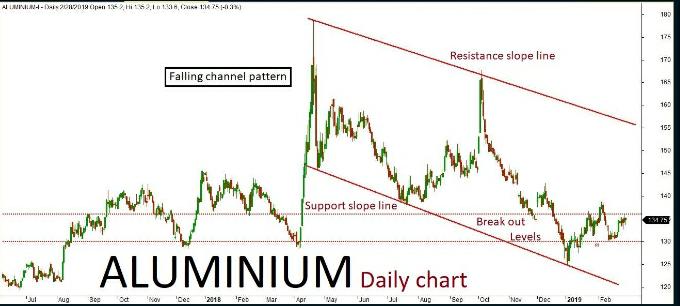
Aluminium daily chart has formed “Falling channel” pattern. The last few sessions ended up in bearish trend after a long gap up formation inside the channel. The market is expected to continue on the bearish trend based on the current price action, once the same breaks below a key support holding at 145. The downside rally could be testing all the way through 144-143 levels in the upcoming sessions. Alternatively, if the key support holds strong then the market might retest the same and turn bullish. he upside rally could test up to 151 level. Key resistance holds at 151.
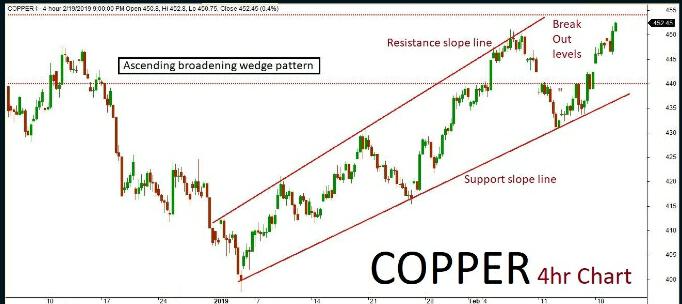
Copper
Copper 4hr chart has formed “Ascending broadening wedge” pattern. The last session been in bullish trend and consolidated on a gap down formation inside the channel. The market is expected to continue on bullish momentum based on the current price action, once the same breaks above a key resistance holding at 460. The upside rally could be testing all the way through 464-468 levels in the upcoming sessions. Alternatively, if the key resistance holds strong then the market might retest the same and turn bearish once again. The downside rally could test up to 453 level. Key support holds at 453.
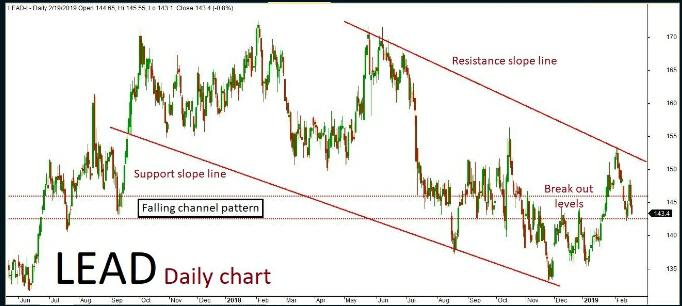
Lead
Lead daily chart has formed “Falling channel” pattern. The last session ended up bearish in trend after few positive rallies inside the channel. The market is expected to continue on bearish momentum based on the current price action, once the same breaks below a key support holding at 149. The downside rally could be testing all the way up to 1488-147 levels in the upcoming sessions. Alternatively, if the key support holds strong then the market might retest the same and turn bullish once again. The upside rally could test up to 151-152 level. Key resistance holds at 152.
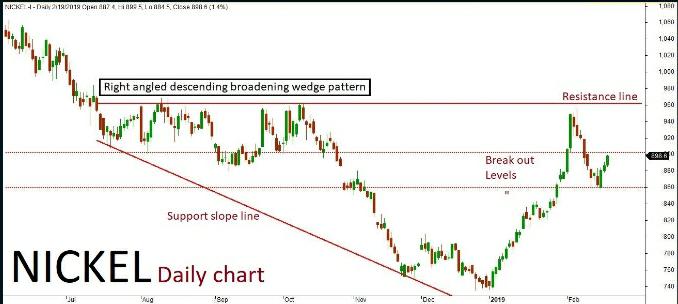
Nickel
Nickel daily chart has formed “Right angled Descending broadening wedge” pattern. The last few sessions been in bullish trend along with some corrections inside the channel. The market is expected to continue on the bullish term based on the current price action, once the same breaks above a key resistance holding at 945. The upside rally could be testing all the way through 950-960 levels in the upcoming sessions. Alternatively, if the key resistance holds strong then the market might retest the same and turn bearish once again. The downside rally could test up to 151 level. Key resistance holds at 151.
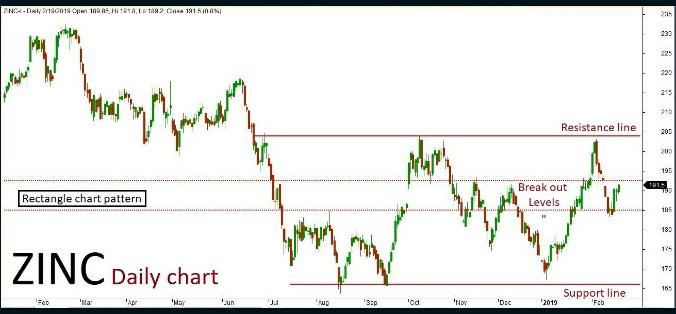
Zinc
Zinc daily chart has formed “Rectangle chart” pattern. The last sessions ended up bearish in trend after few positive rallies inside the channel. The market is expected to continue on bearish momentum based on the current price action, once the same breaks below a key support holding at 195.50. The downside rally could be testing all the way through 194-192 levels in the upcoming sessions. Alternatively, if the key support holds strong then the market might retest the same and turn bullish once again. The upside rally could test up to 199-201 levels. Key resistance holds at 201.
Recent Comments