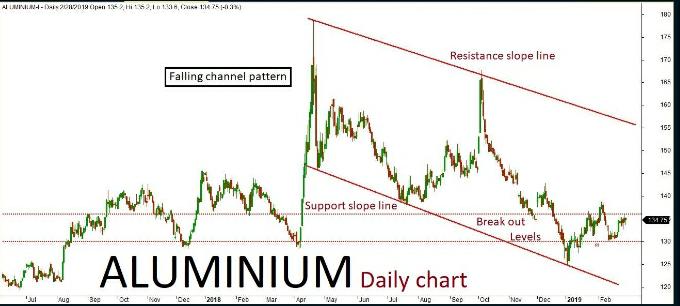
Aluminium daily chart has formed a “Falling channel” pattern. The last few sessions ended up in a sideways trend but also bullish along with some corrections inside the channel. The market is expected to continue on the bullish trend based on the current price action, once the same breaks above a key resistance holding at 136. The upside rally could be testing all the way through 138-140 levels in the upcoming sessions. Alternatively, if the key resistance holds strong then the market might retest the same and turn bearish once again. The downside rally could test up to 133 130 levels. Key support holds at 130.
Copper
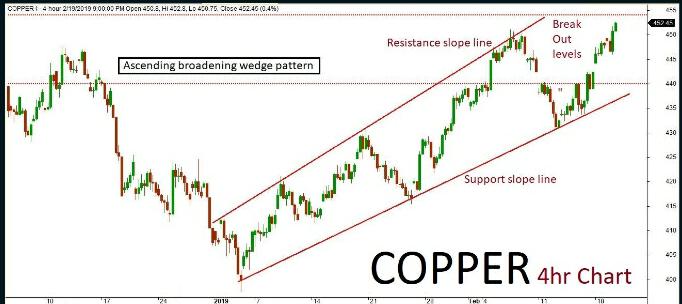
Copper 4hr chart has formed “Ascending broadening wedge” pattern. The last few sessions been in bullish trend and consolidated inside the channel. The market is expected to continue on bullish momentum based on the current price action, once the same breaks above a key resistance holding at 466. The upside rally could be testing all the way through 470-475 levels in the upcoming sessions. Alternatively, if the key resistance holds strong then the market might retest the same and turn bearish once again. The downside rally could test up to 458 level. Key support holds at 458.
Lead
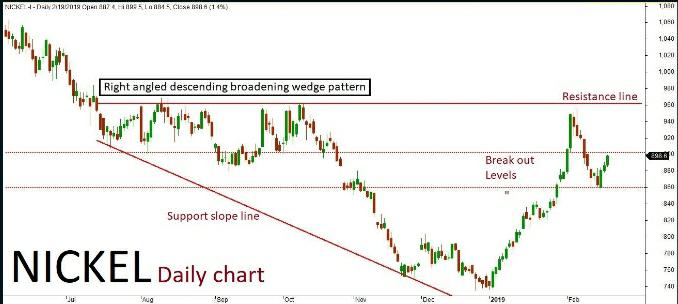
Nickel
Nicked daily chart has formed “Right angled Descending broadening wedge” pattern. The last few sessions been in bullish trend along with some corrections inside the channel. The market is expected to continue on the bullish term based on the current price action, once the same breaks above a key resistance holding at 930. The upside rally could be resting all the way through 940-950 levels in the upcoming sessions. Alternatively, if the key resistance holds strong then the market might retest the same and turn bearish once again. The downside rally could test up to 915-900 levels. Key support hold at 900.
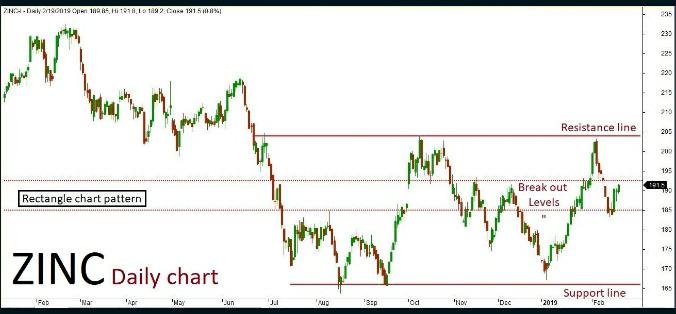
Zinc
Zinc daily chart has formed “Rectangle chart” pattern. The last few sessions ended up bullish in rend along with some corrections inside the channel. The market is expected to continue on bullish momentum based on the current price action, once the same breaks above a key resistance holding at 200. The upside rally could be testing all the way through 202-204 levels in the upcoming sessions. Alternatively, if the key resistance holds strong then the market might retest the same and turn bearish once again. The downside rally could test up to 195-193 levels. Key support holds at 193.
Recent Comments