by abhinav | Feb 18, 2019 | News
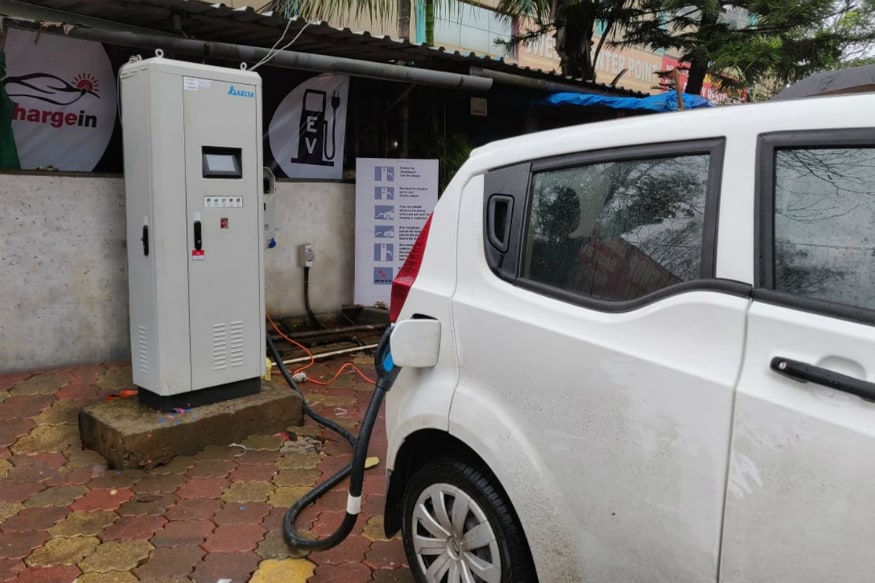
The government expects 25 percent of the total vehicles on roads will be electric vehicles by 2030, necessitating to erect robust electric vehicle (EV) charging infrastructure across the country. Read More
reported by PTI at News18.com
by abhinav | Feb 18, 2019 | News

Both are adventure tourers, TRK 502X is a little more equipped though. Read More
reported by Pearl Daniels at Rushlane.com
by Rahul Rana | Feb 18, 2019 | Analysis, Market-Watch Staff
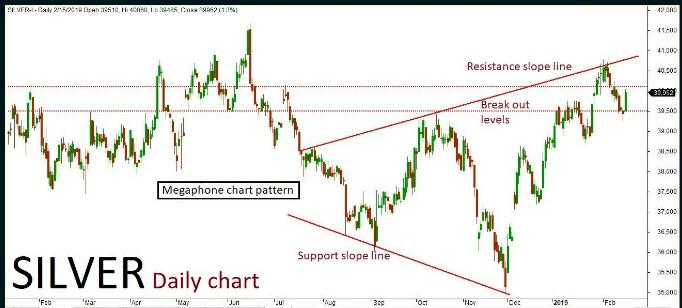
MCX Silver March futures technical chart has taken the formation of “Megaphone chart” pattern in daily time frame. Last sessions ended up in bullish trend aftera few negative rallies inside the channel, where the market is expected to continue on the bullish trend. The continuation of the trend will be confirmed once the price breaks above a key resistance holding at 40100. The positive rally could be extending all the way up to 40300-40500 levels in the upcoming sessions. An alternative scenario indicates that if the key resistance holds strong then the market might have a chance to retest the same and revise the trend to bearish once again. The downside rally could test up to 39800-39500 levels. Key support holds at 39500.
by abhinav | Feb 18, 2019 | News

The Benelli TRK 502 is the newest adventure tourer on sale in India and the Italian bike maker’s first offering in the highly popular segment. Read More
reported by at Ndtv.com
by Rahul Rana | Feb 18, 2019 | Analysis, Market-Watch Staff
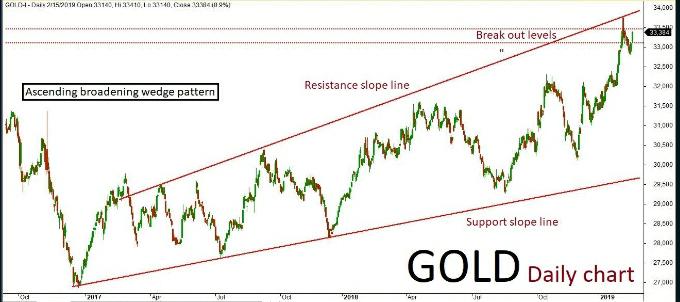
MCX Gold April futures technical chart has taken the formation of “Ascending broadening wedge” pattern in daily time frame. Last few sessions ended up bullish in trend along with some corrections inside the channel, where the market is expected to continue on bullish momentum. The continuation of the trend will be confirmed once the price breaks above a key resistance holding at 33450. The positive rally could be extending all the way up to 33550-33600 levels in the upcoming sessions. An alternative scenario indicates that if the key resistance holds strong then the market might have a chance to retest the same and revise the trend to bearish once again. The downside rally could test up to 33200-33100 levels. Key support holds at 33100.
Recent Comments