The department had sought think tank’s suggestions on the 4G spectrum allocation proposals from the state-driven telcos which felt that such was much-needed to stay competitive with the likes of Reliance Jio as well as Vodafone Idea and Bharti Airtel. Read More
reported by Muntazir Abbas, ET Telecom at The Times of India
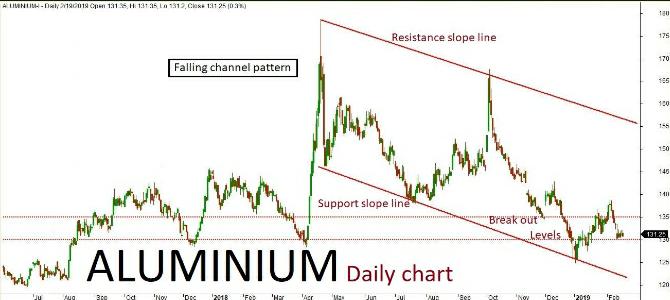
Aluminium daily chart formed “Falling channel” pattern. The last few sessions ended up in sideways trend along with some corrections inside the channel. The market is expected to continue on the bullish trend based on the current price action, testing all the way through 133-135 levels in the upcoming sessions. Alternatively, if market breaks below a key support holding at 130 then it might turn bearish once again. The downside rally could test up to 128-126 levels. Key resistance holds at 135.
Aluminium Feb Futures
Copper
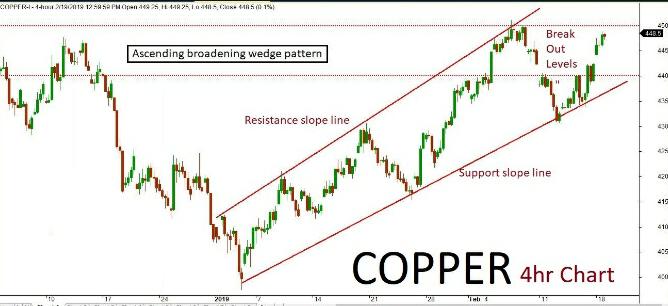
Copper 4hr chart has formed “Ascending broadening wedge” pattern. The last few sessions been in bullish trend but also consolidated near the channel’s support slope line. the market is expected to continue on bullish momentum based on the current price action, once the same breaks above a key resistance holding at 450. The upside rally could be testing all the way through 454-458 levels in the upcoming sessions.Alternatively, if the key resistance holds strong then the market might retest the same and turn bearish once again. The downside rally could test up to 445-440 levels. Key support holds at 440.
copper Feb Futures
Lead
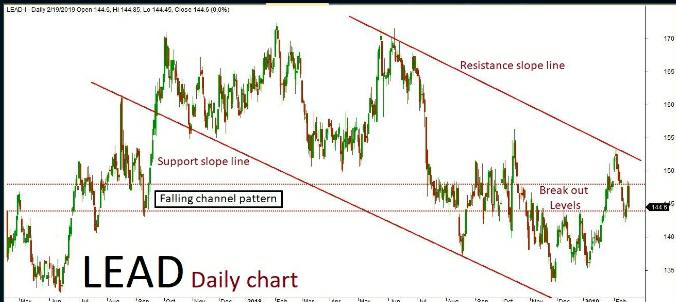
Lead daily chart has formed “Falling channel” pattern. The last session ended up bearish in trend after few positive rallies inside the channel. The market is expected to continue on bearish momentum based on the current price action, once the same breaks below a key support holding at 144. The downside rally could be testing all the way up to 143-142 levels in the upcoming sessions. Alternatively, if the key support holds strong then the market might retest the same and turn bullish once again. The upside rally could test up to 146-148 level. Key resistance holds at 148.
Lead Feb Futures
Nickel
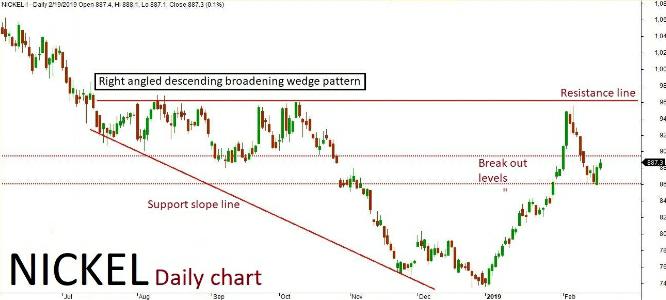
Nickel daily chart has formed “Right-angled Descending broadening wedge” pattern. The last session has been in bullish trend after a few negative rallies inside the channel. The market is expected to continue on the bullish term based on the current price action, once the same breaks above a key resistance holding at 895. The upside rally could be testing all the way through 900-910 levels in the upcoming sessions. Alternatively, if the key resistance holds strong then the market might retest the same and turn bearish once again. The downside rally could test up to 870-860 levels. Key support holds at 860.
Nickel Feb Futures
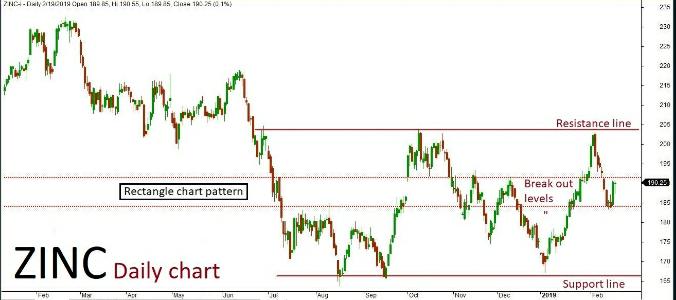
Zinc
Zinc daily chart has formed a “Rectangle chart” pattern. The last session ended up bullish in trend after a few negative rallies inside the channel. The market is expected to continue on bullish momentum based on the current price action, once the same breaks above a key resistance holding at 191.50. The upside rally could be testing all the way through 193-195 levels in the upcoming sessions. Alternatively, if the resistance holds strong then the market might retest the same and turn bearish once again. The downside rally could test up to 186-184 levels. Key support holds at 184.
The new Honda Civic has received a 5-star safety rating from ASEAN NCAP. It comes in a choice of 5 colour options. Images credit to Luv Tandon / HVK FB Group. Read More


Recent Comments