by abhinav | Feb 20, 2019 | News

Apart from the usual steps — such as cutting down on loss-making routes, focussing on revenue management and cost optimization — Jet Airways has come up with a resolution plan in order to continue to navigate the sky and avoid a crash landing. Read More
reported by News18.com at News18.com
by Rahul Rana | Feb 20, 2019 | Analysis, Market-Watch Staff
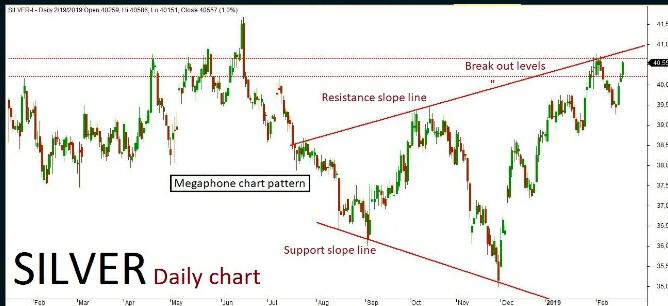
MCX Silver March futures technical chart has taken the formation of “Megaphone chart” pattern in daily time frame. Last few sessions ended up in bullish trend along some corrections inside the channel, where the market is expected to continue on the bullish trend. The continuation of the trend will be confirmed once the prices breaks above a key resistance holding at 40660. The positive rally could be extending all the way up to 40800-41000 levels in the upcoming sessions. Alternative scenario indicates that if the key resistance holding strong then the market might have a chance to retest the same and revise the trend to beaish once again. The downside rally could test up to 40400-40200 levels. Key support holds at 40200.
by Rahul Rana | Feb 20, 2019 | Analysis, Market-Watch Staff
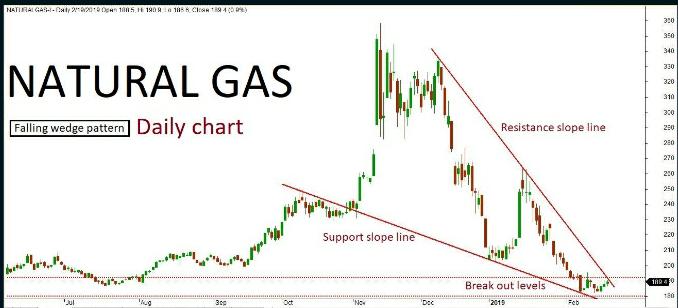
Natural gas daily chart has formed “Falling wedge” pattern. The last few sessions ended up in sideways trend retest near the channel,s support slope line. The market is expected to continue on bullish momentum based on the price action, once the same breaks above a key resistance holding at 192. The upside rally could be testing all the way through 194-198 levels in the upcoming sessions. Alternatively, if the key resistance holds strong then the market might retest the same and turn bearish. The downside rally could test up to 180 level. Key support holds at 180.
by Rahul Rana | Feb 20, 2019 | Analysis, Market-Watch Staff
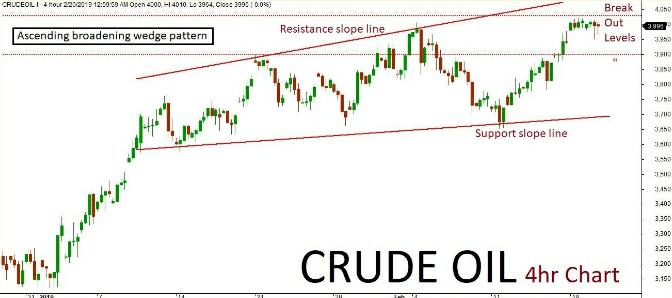
MCX Crude Oil futures technical chart has taken the formation of “Ascending broadening wedge” pattern in 4-hours’ time frame. Previously few sessions ended up bullish in trend and retesting inside the channel. As per the technical aspects based on the current price action, the market is expected to continue on a bullish trend. The continuation of the trend will be confirmed once the price breaks above a key resistance holding at 4030. The positive rally could be testing all the way up to 4100-4150 level in the upcoming sessions. Alternative scenario indicates that if key resistance holds strong then the market might have chance to retest the same and revise the trend to bearish once again. Sch reversal could possibly test up to 3900 levels. Key support holds at 3900.
by Rahul Rana | Feb 20, 2019 | Analysis, Market-Watch Staff
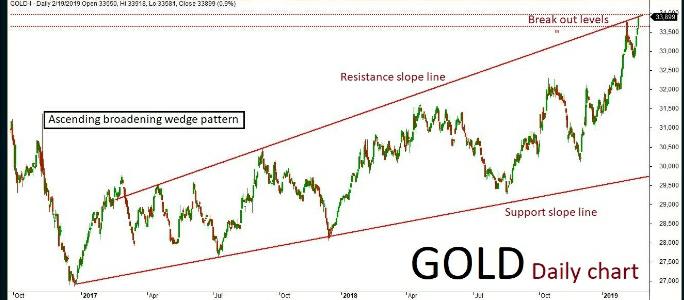
MCX Gold April futures technical chart has taken the formation of “Ascending broadening wedge” pattern in the daily time frame. Last few sessions ended up bullish in trend along with some corrections inside the channel, where the market is expected to continue on bullish momentum. The continuation of the trend will be confirmed once the price breaks above a key resistance holding at 33950. The positive rally could be extending all the way up to 34100-34200 levels in the upcoming session. An alternative scenario indicates that if the key resistance holds strong then the market might have a chance to retest the same and revise the trend to bearish once again. The downside rally could test up to 33800-33650 levels. Key support holds at 33650.
Recent Comments