by Rahul Rana | Feb 21, 2019 | Analysis, Market-Watch Staff
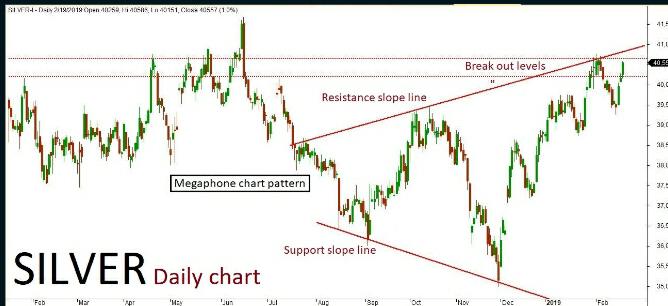
MCX Silver March futures technical chart has taken the formation of “Megaphone chart” pattern in daily time frame. Last few sessions ended up in bullish trend along with some corrections retesting near the channel’s resistance slope line, where the market is expected to continue on the bearish trend. The negative rally could be extending all the way up to 40800-40500 levels in the upcoming sessions. An alternative scenario indicates that if the market breaks above a key resistance holding at 41000 then the market might continue on bullish once again. The upside rally could test up to 41200 level. Key support holds at 40500.
by Rahul Rana | Feb 21, 2019 | Analysis, Market-Watch Staff
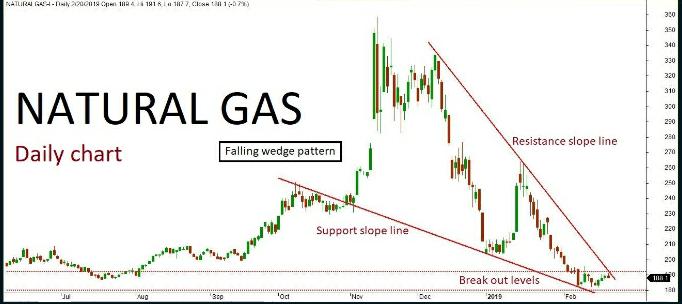
Natural gas daily chart formed “Falling wedge” pattern. The last few sessions ended up in sideways trend retesting near the channel,s resistance slope line. The market is expected to continue on bullish momentum based on the price action, once the same breaks above a key a key resistance holding at 192. The upside rally could be testing all the way through 194-198 levels in the upcoming sessions. Alternatively, if the key resistance holds strong then the market might retest the same and turn bearish. The downside rally could test up to 180 level. Key support holds at 180.
by Rahul Rana | Feb 21, 2019 | Analysis, Market-Watch Staff
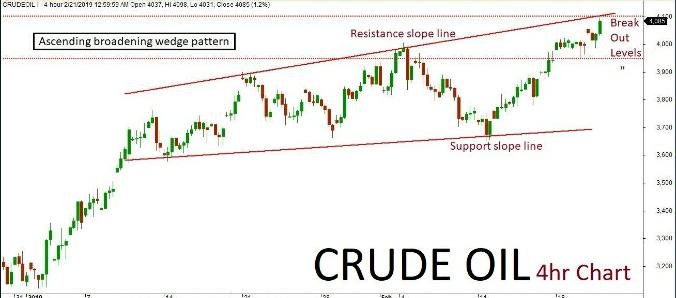
MCX crude Oil futures technical chart has taken the formation of “Ascending broadening wedge” pattern in 4-hours’ time frame. Previously few sessions ended up bullish in trend and retesting inside the chancel. As per the technical aspects based on the current price action, the market is expected to continue on bullish trend. The continuation of the trend will be confirmed once the prices breaks above a key resistance holding at 4100. The positive rally could be testing all the way up to 4150-4200 level in the upcoming session. An alternative scenario indicates that if key resistance holds strong then the market might have a chance to retest the same and revise the trend to bearish once again. Such reversal could possibly test up to 3950 level. Key support holds at 3950.
by abhinav | Feb 21, 2019 | News

Does the RE Interceptor 650 has what it takes to rival against the Street Twin which is an entry-level offering from a premium motorcycle manufacturer like Triumph Triumph has launched the new 2019 Street Twin in India recently. There is no doubt in the fact … Read More
reported by Vibin P Vijay at Gaadiwaadi.com
by abhinav | Feb 21, 2019 | News

Holding company Wadhawan Global Capital is trying to lure many big investors with a controlling stake. Read More
reported by Jwalit Vyas and Indulal PM at The Times of India
Recent Comments