Piramal had earlier been awarded a stay order from the Supreme Court on the ban against Saridon.Piramal Enterprises shares were trading 1.2% higher at ₹2,221 in noon trade Read More
Reliance Capital on Thursday invited Nippon Life Insurance to acquire nearly 43 per cent stake that it holds in Reliance Nippon Life Asset Management (RNAM). Read More
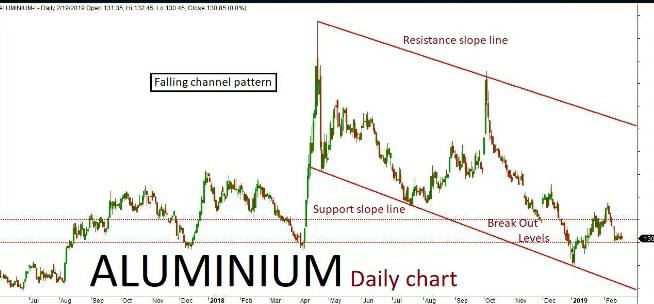
Aluminium daily chart has formed “Falling channel” pattern. The last few sessions ended up in sideways trend along with some corrections inside the channel. The market is expected to continue on the bullish trend based on the current price action, once the same breaks above a key resistance holding at 133. The upside rally could be testing all the way through 135-136 levels in the upcoming sessions. Alternatively, if the key resistance holds strong then the market might retest the same and turn bearish. The downside rally could test up to 130-128 levels. Key support holds at 128.
Aluminium Feb Futures
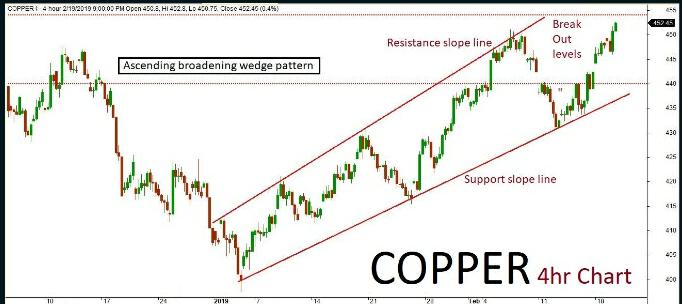
Copper
Copper 4hr chart has formed “Ascending broadening wedge pattern. The last few sessions been in bullish trend but also consolidated near the channel’s support slope line. The market is expected to continue on bullish momentum based on the current price action, once the same breaks above a key resistance holding at 460. The upside rally could be testing all the way through 464-468 levels in the upcoming sessions. Alternatively, if the key resistance holds strong then the market might retest the same and turn bearish once again. The downside rally could test up to 450-445 levels. Key support holds at 445.
Copper Feb Futures
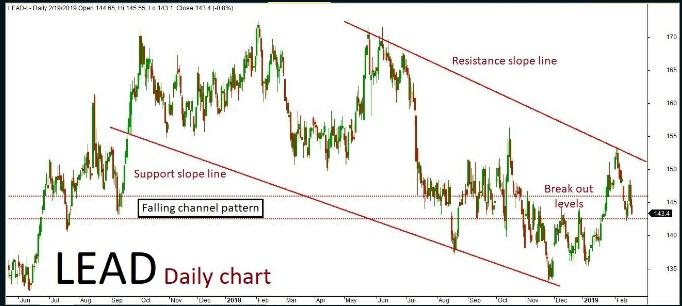
Lead
Lead daily chart has formed “Falling channel” pattern. The last session ended up bullish in trend after few negative rallies inside the channel. The market is expected to continue on bullish momentum based on the current price action, once the same breaks above a key resistance holding at 145.50.The upside rally could be testing all the way through 464-468 levels in upcoming sessions. Alternatively, if the key resistance holds strong then the market might retest the same turn bearish once again. The downside rally could test up to 450-445 levels. Key support holds at 445.
Lead Feb Futures
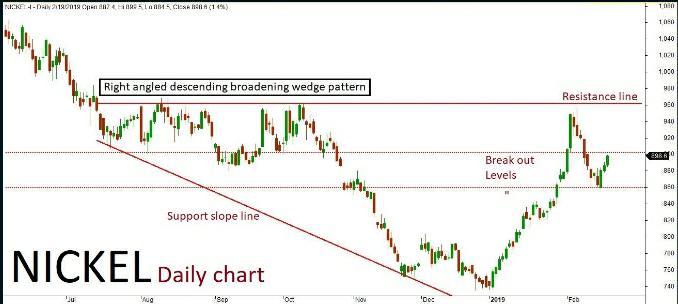
Nickel
Nickel daily chart has formed “Right angled Descending broadening wedge” pattern. The last session been in bullish trend after few negative rallies inside the channel. The market is expected to continue on the bullish term based on the current price action, once the same breaks above a key resistance holding at 920. The upside rally could be testing all the way through 930-940 levels in the upcoming sessions. Alternatively, if the key resistance holds strong then the market might retest the same and turn bearish once again. The downside rally could test up to 900-880 levels. Key support holds at 880.
Nickel Feb Futures
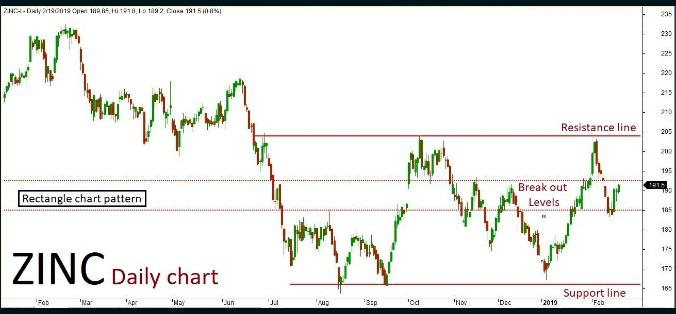
Zinc
Zinc daily chart has formed “Rectangle chart” pattern. The last session ended up bullish in trend after few negative rallies inside the channel. The market is expected to continue on bullish momentum based on the current price action, once the same breaks above a key resistance holding at 195. The upside rally could be testing all the way through 196-198 levels in the upcoming sessions. Alternatively, if the key resistance holds strong then the market might retest the same and turn bearish once again. The downside rally could test up to 191-189 levels. Key support holds at 189.
Ankush Kohli, the aggrieved Tata Nexon owner, says that he should have listened to all those who had suggested him to stay away from purchasing a Tata car The Tata Nexon has been doing pretty well on the sales charts. At first look, it has a lot to offer. We … Read More


Recent Comments