by Rahul Rana | Feb 22, 2019 | Analysis, Market-Watch Staff
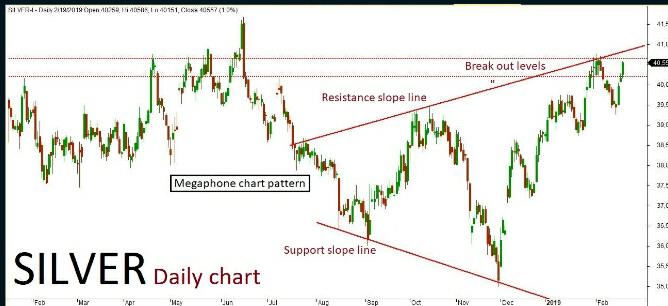
MCX Silver March futures technical chart has taken the formation of “Megaphone chart” pattern in daily time frame. Last session ended up in bearish trend after a long gap down formation inside the channel, where the market is expected to continue on the bearish trend. The continuation of trend will be confirmed once the prices breaks below a key support holding 40,000. The negative rally could be extending all the way up to 39850-39700 levels in the upcoming sessions. An alternative scenario indicates that if the key support holds strong then the market might have a chance to retest the same and revise the trend to bullish once again. The upside rally could test up to 40350-40500 level. Key resistance at 40500.
by abhinav | Feb 22, 2019 | News

About 5.87 crore shares (or 3 percent equity) changed hands via six blocks in opening trade. Read More
reported by BQ Desk at Bloombergquint.com
by abhinav | Feb 22, 2019 | News

LOCs were filed after the FIR and are mandatory in cases where such economic offences are alleged. In recent times, keeping an eye on travel plans is a top concern for regulators Read More
reported by FPJ Web Desk at Freepressjournal.in
by abhinav | Feb 22, 2019 | News

Big name brands like Disney, Epic Games, and Nestle have pulled advertisements from YouTube following a controversy over child exploitation was uncovered. Read More
reported by Anthony Taormina at Gamerant.com
by Rahul Rana | Feb 22, 2019 | Analysis, Market-Watch Staff
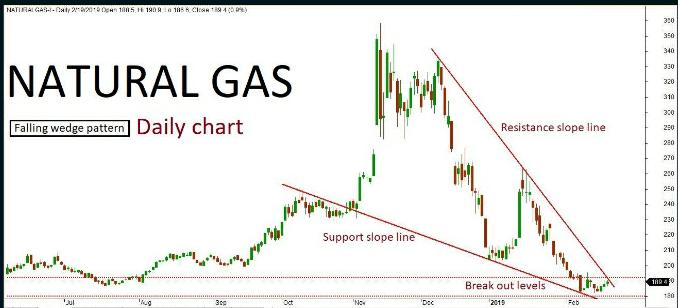
Natural gas daily chart has formed “Falling wedge” pattern. The last few sessions ended up in sideways trend retesting near the channel’s resistance slope line. The market is expected to continue on bullish momentum based on the price action, once the same breaks above a key resistance holding at 195. The upside rally could be testing all the way through 200-210 levels in the upcoming sessions. Alternatively, if the key resistance holds strong then the market might retest the same and turn bearish. The downside rally could test up to 185-180 level. Key support holds at 180.
Recent Comments