by abhinav | Feb 28, 2019 | News

Maruti Suzuki Ertiga Cross will be sold via Nexa premium dealerships and is expected to boast exterior and interior upgrades Maruti Suzuki India Limited (MSIL) has the Cross variant of the Ertiga as its next big launch in the domestic market and we were the f… Read More
reported by Surendhar M at Gaadiwaadi.com
by Rahul Rana | Feb 28, 2019 | Analysis, Market-Watch Staff
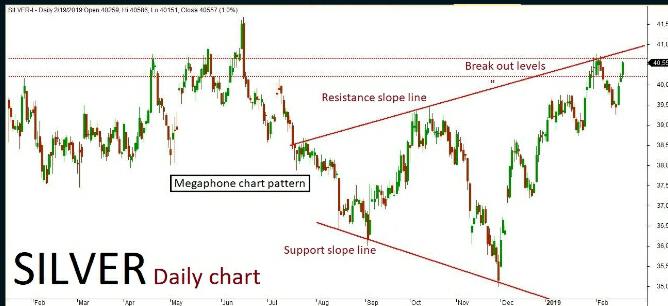
MCX Silver March futures technical chart has taken the formation of “Megaphone chart” pattern in daily time frame. Last Few sessions ended up in bearish trend along with some corrections inside the channel, where the market is expected to the trend will be confirmed once the bearish trend. The continuation of the trend will be confirmed once the price breaks below a key support holding at 39700. The negative rally could be extending all the way up to 39500-39300 levels in the upcoming sessions. An alternative scenario indicates that if the key support holds strong then the market might have chance to retest the same and revise the trend to bullish once again. The upside rally could test up to 40000-40350 level. Key resistance at 40350.
by Rahul Rana | Feb 28, 2019 | Analysis, Market-Watch Staff
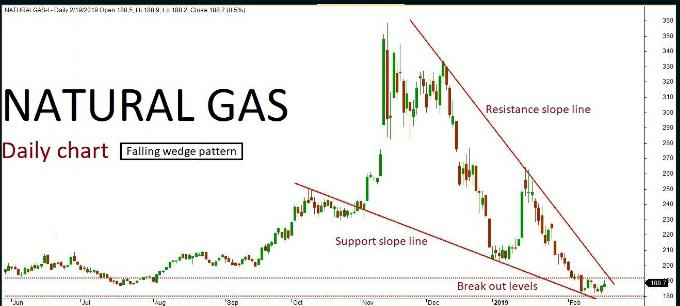
Natural gas daily chart has formed “Falling wedge” pattern. The last few sessions ended up in bullish trend retesting near the channel’s resistance slope line. The market is expected to continue on bullish momentum based on the price action, once the same breaks above a key resistance holding at 202. The upside rally could be testing all the way through 208-212 levels in the upcoming sessions. Alternatively, if the key resistance holds strong then the market might retest the same and turn bearish. The downside rally could test up to 190-185 level. Key support holds at 185.
by abhinav | Feb 28, 2019 | News

New generation Mercedes G Class is on sale in India as the AMG G63 trim, which is priced from Rs 2.2 cr, ex-sh. Read More
reported by Pearl Daniels at Rushlane.com
by Rahul Rana | Feb 28, 2019 | Uncategorized
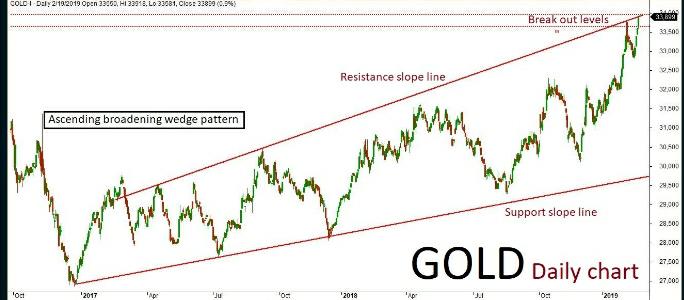
MCX Gold April futures technical chart has taken the formation of “Ascending broadening wedge” pattern in daily time frame. Last few sessions ended up bearish in trend along with some corrections inside the channel, where the market is expected to continue on bearish momentum. The continuation of trend will be continue on bearish momentum. The continuation of the trend will be confirmed once the prices breaks below a key support holding at 33280. The negative rally could be extending all the way up to 33200-33100 levels in the upcoming sessions. An alternative scenario indicates that if the upcoming sessions. An alternative scenario indicates that if the key support holds strong then the market might have a chance to retest the same and revise the trend to bullish once again. The upside rally could test up to 33450-33600 levels. Key resistance holds at 33600.
Recent Comments