by abhinav | Feb 25, 2019 | News

Mahindra has taken their first proper step towards electric mobility today with the launch of the premium electric mobility service Glyd making their first move into the MaaS space as an independent supplier of the service, not just the vehicle! Read More
reported by Dipayan Dutta at Financialexpress.com
by abhinav | Feb 25, 2019 | News

The Gurgaon Police will be using these Mahindra Scorpio SUVs within city limits and hence received the 4X2 variants. Read More
reported by Pearl Daniels at Rushlane.com
by abhinav | Feb 25, 2019 | News

Systematic mispricing of risk could result in solvency issues for the NBFC sector as a whole. Read More
reported by Harsh Vardhan, Rajeswari Sengupta at Bloombergquint.com
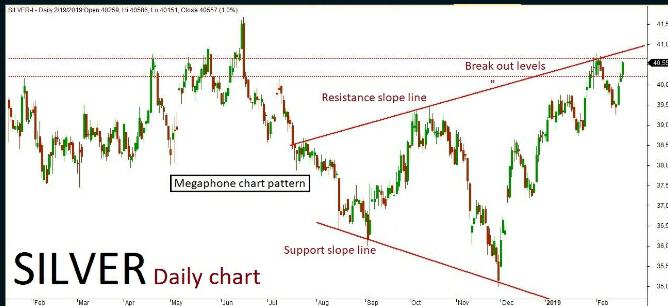
by Rahul Rana | Feb 25, 2019 | Analysis, Market-Watch Staff
MCX Silver March futures technical chart has taken the formation of “Megaphone chart” pattern in daily time frame. Last session ended up in bullish trend after a long gap down formation inside the channel, where the market is expected to continue on the bullish trend. The positive rally could be extending all the way up to 40500-40700 levels in the upcoming sessions. An alternative scenario indicates that if the market breaks below a key support holding at 40150 then it might revise the trend to bearish once again. The downside rally could test up to 40000-39800 level. Key resistance at 40700.
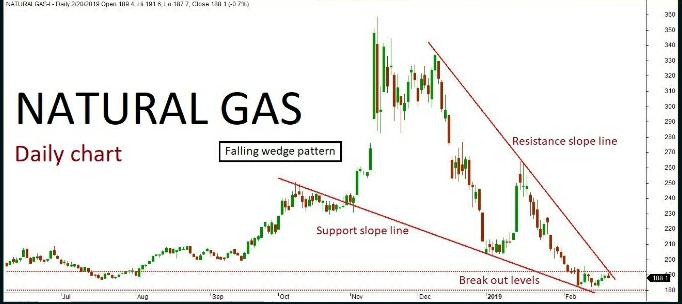
by Rahul Rana | Feb 25, 2019 | Analysis, Market-Watch Staff
Natural gas daily chart has formed a “Falling wedge” pattern. The last few sessions ended up in sideways trend resisting near the channel’s resistance slope line. The market is expected to continue on bullish momentum based on the price action, once the same breaks above a key resistance holding at 195. The upside rally could be testing all the way through 200-21 levels in the upcoming sessions.Alternativelet if the key resistance holds strong then the market might retest the same and turn bearish. The downside rally could test up to 185-180 level. Key support holds at 180.
Recent Comments