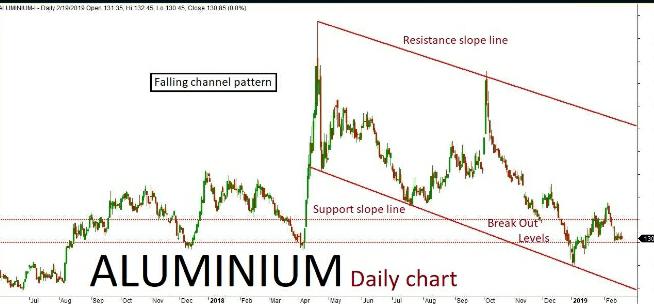
Aluminium daily chart has formed “Falling channel” pattern. The last few sessions ended up in bullish trend along with some corrections inside the channel. The market is expected to continue on the bullish trend based on the current price action, once the same breaks above a key resistance holding at 135.50. The upside rally could be testing all the way through 137-139 levels in the upcoming sessions. Alternatively, if the key resistance holds strong then the market might retest the same and turn bearish. The downside rally could test up to 132-130 levels. Key support holds at 130.
Aluminium Feb Futures
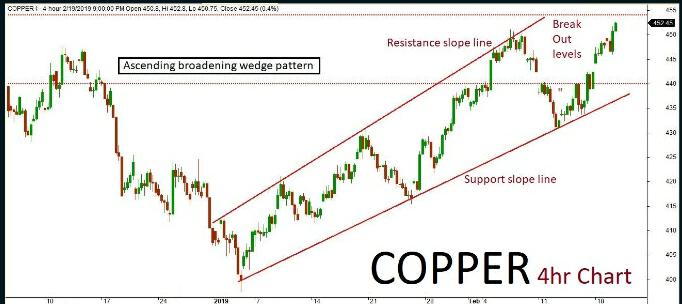
Copper
Copper 4hr chart has formed “Ascending broadening wedge” pattern. The last few sessions been in bullish trend but also consolidated near the channel’s support slope line. The market is expected to continue on bullish momentum based on the current price action, once the same breaks above a key resistance holding at 464. The upside rally could be testing all the way through 468-452 levels in the upcoming sessions. Alternatively, if the key resistance holds strong then the market might retest the same and turn bearish once again. The downside rally
Copper Feb Futures
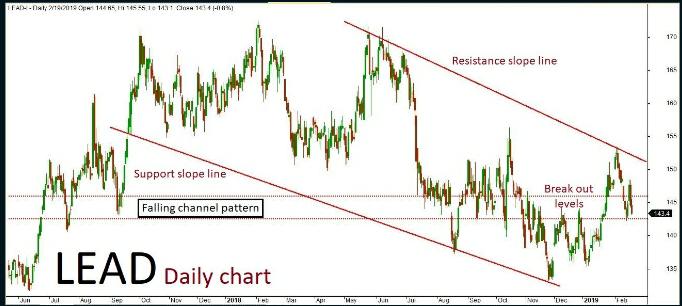
Lead
Lead daily chart has formed “Falling channel” pattern. The lat session ended up bearish in trend after few positive rallies inside the channel. The market is expected to continue on bearish momentum based on the current price action, testing all the way up to 144.50-143 levels in the upcoming sessions. Alternatively, if the market breaks above a key resistance holding at 147 then it might turn bullish once again. The upside rally could test up to 148-149 level. Key support holds at 143.
Lead Feb Futures
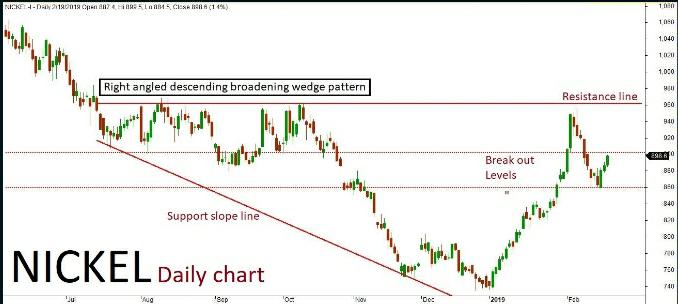
Nickel
Nickel daily chart has formed “Right angled Descending broadening wedge” pattern. The last few sessions been in bullish trend along with some corrections inside the channel. The market is expected to continue on the bullish tern based on the current price action, once the same breaks above a key resistance holding at 922. The upside rally could be testing all the way through 930-940 levels in the upcoming sessions. Alternatively, if the key resistance holds strong then the market might retest the same and turn bearish once again. The downside rally could test up to 900-890 levels. Key support holds at 890.
Nickel Feb Futures
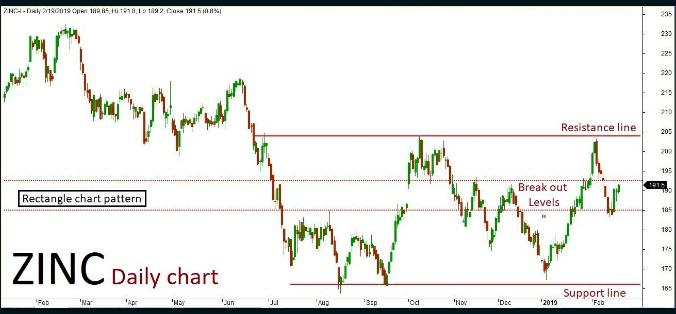
Zinc
Zinc daily chart formed “Rectangle chart” pattern. The last few sessions ended up bullish in trend along with some corrections inside the channel. The market is expected to continue on bullish momentum based on the current price action, once the same breaks above a key resistance holding at 195.50. The upside rally could be testing all the way through 197-199 levels in the upcoming sessions. Alternatively, if the key resistance holds strong then the market might retest the same and turn bearish once again. The downside rally could test up to 192-190 levels. Key support holds at 190
MG Motors will soon launch the all-new Hector later this year to take on the likes of Jeep Compass in the Indian market. It will get both petrol and diesel engine options MG Motors will enter the Indian market with their all-new SUV later this year. The all-n… Read More


Recent Comments