
by Rahul Rana | Feb 26, 2019 | Analysis, Market-Watch Staff
MCX Crude Oil futures technical chart has taken the formation of “Ascending broadening wedge” pattern in 4-hours’ time frame. Previous session ended up bearish in trend after retesting slope line. As per the technical aspects based on the current price action, the market is expected to continue on bearish trend. The continuation of the trend will be confirmed once the price breaks below a key support holding at 3900. The negative rally could be testing all the way up to 3850-3800 level in the upcoming sessions. An alternative scenario indicates that if the key support holds strong then the market might have a chance to retest the same and revise the trend to bullish once again. Such reversal could positive test up to 4020-4100 level. Key resistance holds at 4100.

by Rahul Rana | Feb 26, 2019 | Analysis, Market-Watch Staff
MCX Gold April futures technical chart has taken the formation of “Ascending broadening wedge” pattern in daily time frame. Last few sessions ended up bearish in trend along with some corrections inside the channel, where the market is expected to continue on bearish momentum. The continuation of the trend will be confirmed once the prices breaks below a key support holding at 33330. The negative rally could be extending all the way up to 33200-33100 levels in the upcoming sessions. An alternative scenario indicates that if the key support holds strong then the market might have a chance to retest the same and revise the trend to bullish once again. The upside rally could test up to 33450-33600 levels. Key resistance holds at 33600.
by abhinav | Feb 26, 2019 | News

Earlier this month, the company named Starbucks Corp’s Chief Operating Officer Rosalind Brewer as a director, the second black woman to serve on its board. Read More
reported by Reuters at News18.com
by abhinav | Feb 26, 2019 | News

The all-new Maruti Suzuki Swift looks very good in stock form, a few modifications were done to it make it look even better and unique Maruti launched the all-new Swift in the Indian market last year. The popular hatchback based on the all-new HEARTECT platfo… Read More
reported by Vibin P Vijay at Gaadiwaadi.com
by abhinav | Feb 26, 2019 | News
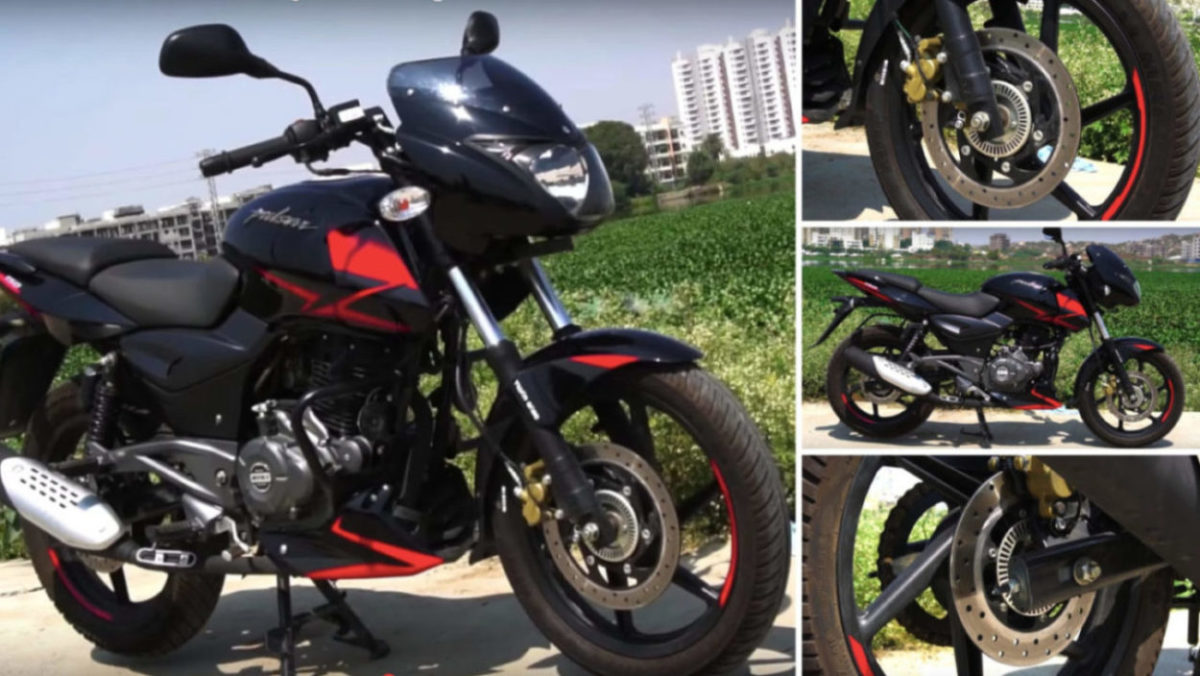
The updated 2019 Bajaj Pulsar 150 gets a single channel ABS and takes its styling cues from the Pulsar 180 We already have reported earlier that Bajaj’s best selling Pulsar model will get the much-awaited ABS update soon. Few Bajaj dealerships are also provid… Read More
reported by Vibin P Vijay at Gaadiwaadi.com
Recent Comments