by abhinav | Feb 26, 2019 | News

Citroen’s first vehicle for India is expected to be launched towards the end of 2021 and it could feature high levels of localisation Ever since Groupe PSA announced its intentions to enter the Indian market, speculations over which brand it would choose had … Read More
reported by Surendhar M at Gaadiwaadi.com
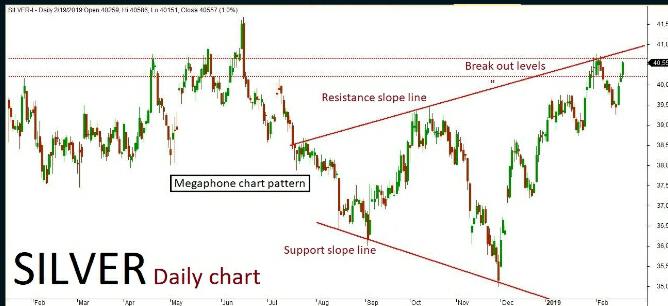
by Rahul Rana | Feb 26, 2019 | Analysis, Market-Watch Staff
MCX Silver March futures technical chart has taken the formation of “Megaphone chart” pattern in daily time frame. Last few sessions ended up in bearish trend along with some corrections inside the channel, where the market is expected to continue on the trend. The continuation of the trend will be confirmed once the price breaks below a key support holds holding at 39900. The negative rally could be extending all the way up to 39800-39600 levels in the upcoming sessions. An alternative scenario indicates that if the key support holds strong then the market might have a chance to retest the same and revise the trend to bullish once again. The upside rally could test up to 40350 level. Key resistance at 40350.
by abhinav | Feb 26, 2019 | News

Tata Harrier is officially not available with dual tone colour options as of now. Read More
reported by Yashaswi Patel at Rushlane.com
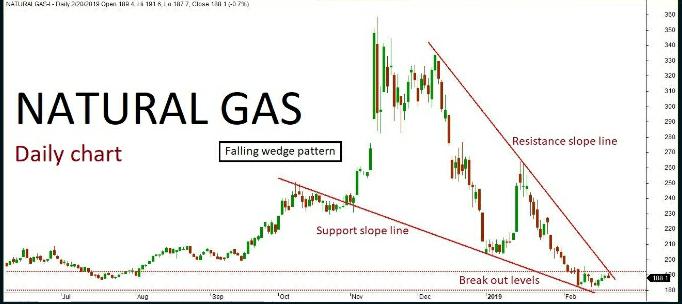
by Rahul Rana | Feb 26, 2019 | Analysis, Market-Watch Staff
Natural gas daily chart has formed “Falling wedge” pattern. The last few sessions ended up in bullish trend retesting near the channel’s resistance slope line. The market is expected to continue on bullish momentum based on the price action, once the same breaks above a key resistance holding at 200. The upside rally could be testing all the way through 205-210 levels in the upcoming sessions. Alternatively, if the key resistance holds strong then the market might retest the same and turn bearish. The downside rally could test up to 190-185 level. Key support holds at 185.
by abhinav | Feb 26, 2019 | News
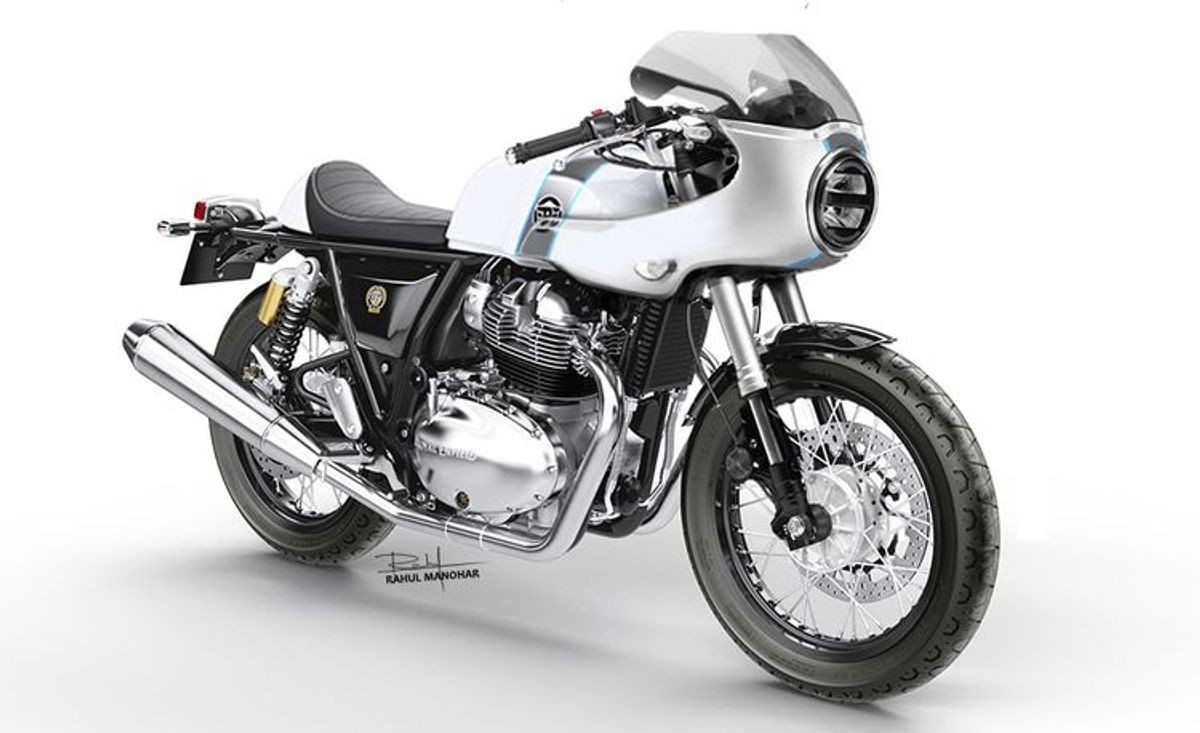
The Continental GT 650 rendered with café racer design and modern parts like an LED headlamp and upside down forks Thanks to the aggressive pricing from Royal Enfield, the 650 Twins are selling in good numbers. But the 650 Twins doesn’t come with modern featu… Read More
reported by Vibin P Vijay at Gaadiwaadi.com
Recent Comments