Jawa Perak launch delayed to end 2019 – Confirms company – RushLane

Jawa Perak is the flagship Jawa, which was showcased on 15th Nov 2018. Read More
reported by Varun at Rushlane.com
Jawa Perak is the flagship Jawa, which was showcased on 15th Nov 2018. Read More
reported by Varun at Rushlane.com
Peugeot Group today officially confirmed that they will enter the Indian auto industry. Read More
reported by Manmeet at Rushlane.com

Find out whether the TVS Apache RTR 160 4V ABS variant offers more value for money when we compare it with its rivals TVS have recently introduced the Apache RTR 160 4V ABS variant in India. The ABS safety feature is available only with the FI variant as of n… Read More
reported by Riju Ganguly at Gaadiwaadi.com

This would be a bigger deficit than those of its larger rivals Bharti Airtel and Vodafone Idea. Read More
reported by P R Sanjai at Bloombergquint.com
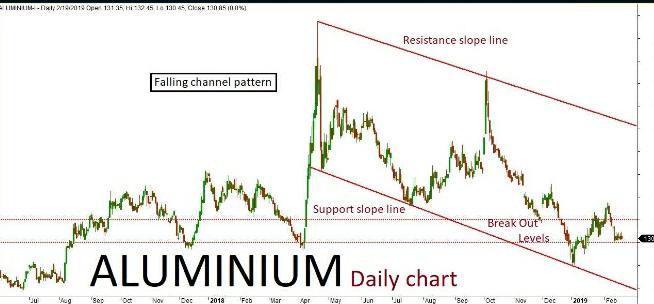
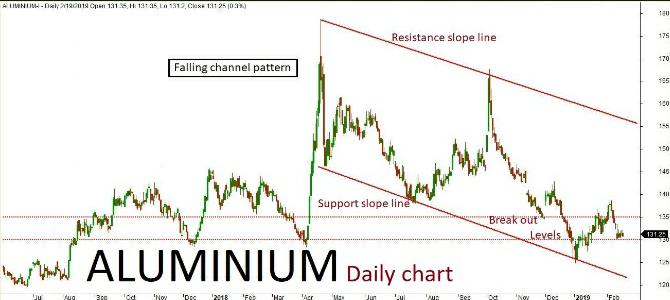
Aluminium daily chart has formed “Falling channel” pattern. The last session ended up in bearish trend after few positive rallies inside the channel. The market is expected to continue on the bearish trend based on the current price action, testing all the way through 132-130 levels in the upcoming sessions. Alternatively, if the market breaks above a key resistance holding at 135 then it might turn bullish once again. The upside rally could test up t 136-138 levels. Key support holds at 130.
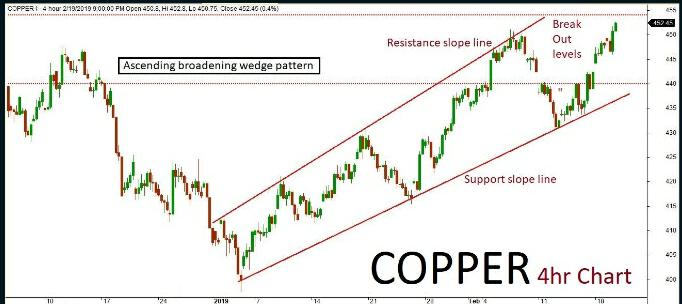
Copper
Copper 4hr chart formed “Ascending broadening wedge” pattern. The last session been in bearish trend but also consolidated after few positive rallies inside the channel. The market is expected to continue on bearish momentum based on the on the current price action, once the same breaks below a key support holding at 458. The downside rally could be testing all the way through 454-450 levels in the upcoming sessions. Alternatively, ih the key support holds strong then the market might retest the same and turn bullish once again. The upside rally could test up to 466 level. Key resistance holds at 466.
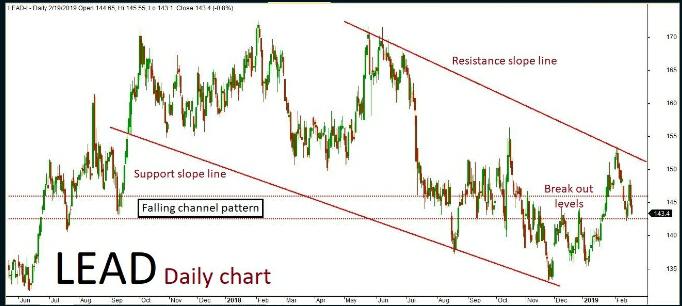
Lead
Lead daily chart has formed “Falling channel” pattern. The last few sessions ended up bullish in trend along with some corrections inside the channel. The market is expected to continue on bullish momentum based on the current price action, once the same breaks above a key resistance holding at 148. The upside rally could be testing all the way up to 149-150 levels in the upcoming sessions. Alternatively, if the key resistance holds strong then the market might retest the same and turn bearish once again. The downside rally could test up to 146-144 level. Key support holds at 144.
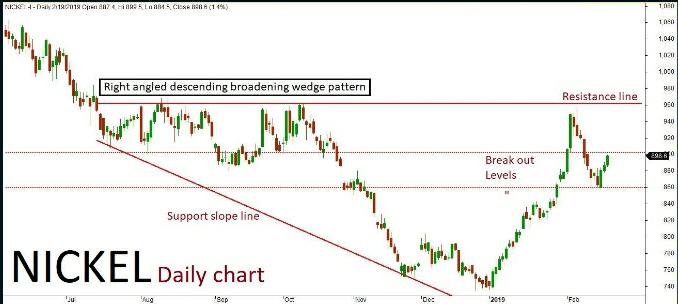
Nickel
Nickel daily chart has formed “Right angled Descending broadening wedge” pattern. The last sessions been in bearish trend after few positive rallies inside the channel. The market is expected to continue on the bearish term based on the current price action, once the same breaks below a key support holding at 908. The downside rally could be testing all the way through 900-890 levels in the upcoming sessions. Alternatively, if the key support holds strong then the market might retest the same and turn bullish once again. The upside rally could test up to 930-940 levels. Key resistance holds at 940.
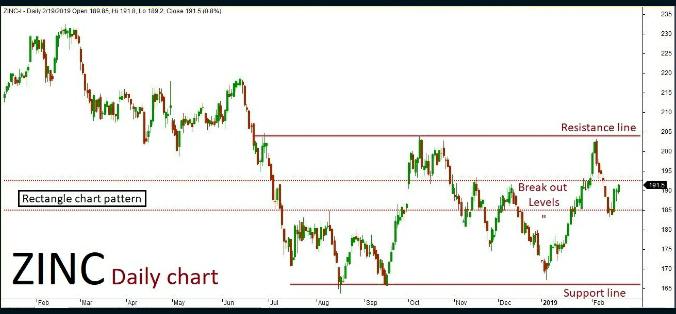
Zinc
Zinc daily chart has formed “Rectangle chart” pattern. The last session ended up bearish in trend after few positive rallies inside the channel. The market is expected to continue on bearish momentum based on the current price action, once the same breaks below a key support holding at 192. The downside rally could be testing all the way through 190-189 levels in the upcoming sessions. Alternatively, if the key support holds strong then the market might retest the same and turn bullish once again. The upside rally could test up to 196-198 levels. Key resistance holds at 198.
Recent Comments