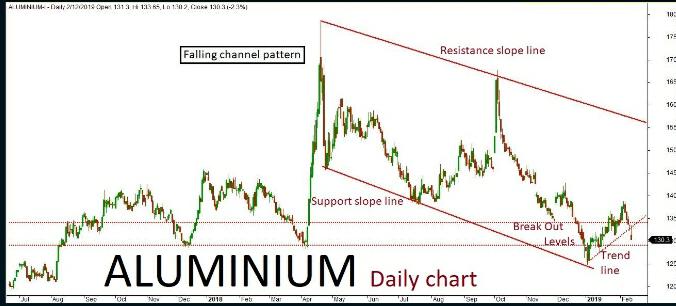
Aluminium daily chart has formed a “Falling channel” pattern. The last few
The market is expected to continue on the bearish trend based on the current price action, once the same breaks below key support holding at 129. The downside rally could be testing all the way through 128-126 levels in the upcoming sessions. ns. Alternatively, if the key support holds strong then the market might retest the same and turn bullish. The upside rally could test up to 132-134 levels. Key resistance holds at 134.
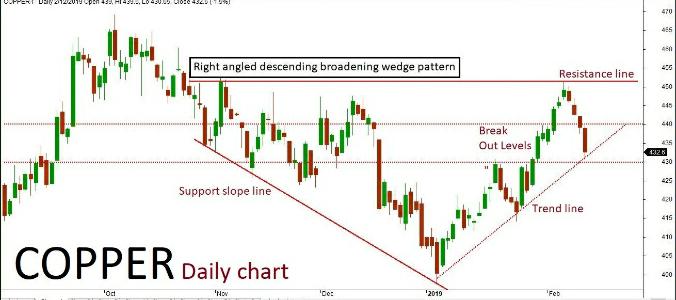
Copper
Technical outlook:
Copper daily chart has formed “Right angled descending broadening wedge” pattern. The last few sessions been in bearish trend along with some corrections inside the channel. The market is expected to continue on bearish momentum based on the current price action, ones the same breaks below a key support holding at 430.The downside rally could be testing all the way through 426-422 levels in the upcoming sessions. Alternatively, if the key support holds strong then the market might retest the same and turn bullish once again. The upside rally could test up to 436-440 levels. Key resistance holds at 440.
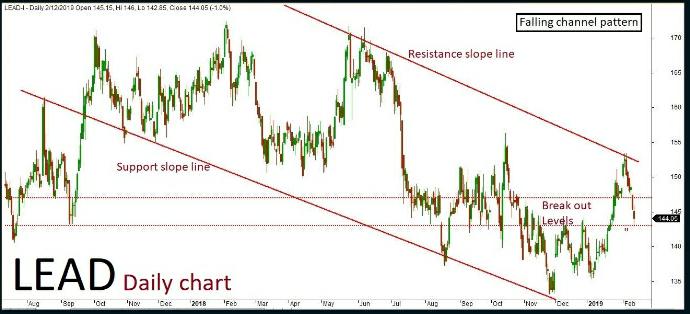
Lead
Technical outlook
Lead daily chart has formed “Falling channel” pattern. The last few sessions ended up bearish in trend along with some corrections inside the channel. The market is expected to continue on bearish momentum based on the current price action, once the same breaks below a key support holding at 143. The downside rally could be testing all the way up to 142-141 levels in the upcoming sessions. Alternatively, if the key support holds strong then the market might retest the same and turn bullish. The upside rally could test up to 145-147 level. Key resistance holds at 147.
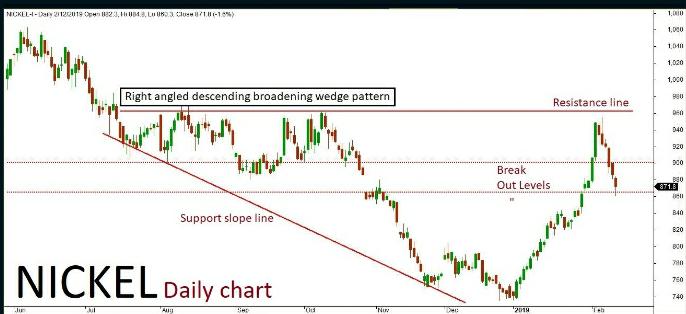
Nickel
Technical outlook
Nickel daily chart has formed “Right-angled Descending broadening wedge” pattern. The last few sessions have been in bearish trend along with some corrections inside the channel. The market is expected to continue on the bearish term based on the current price action, once the same breaks below key support holding at 865. The downside really could be testing all the way through 860-850 levels in the upcoming sessions. Alternatively, if the key support holds strong then the market might retest the same and turn bullish. The upside rally could test up to 885-900 levels. Key resistance holds at 900.
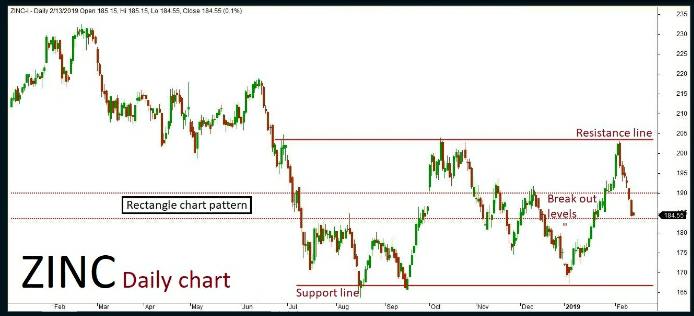
Zinc
Technical outlook
Zinc daily chart has formed “Rectangle chart” pattern. The last session ended up bearish in trend along with some corrections inside the channel. The market is expected to continue on bearish momentum based on the current price action, once the same breaks below a key support holding at 183.50. The downside rally could be testing all the way through 182-180 levels in the upcoming sessions. Alternatively, if the key support holds strong then bullish once again. The upside rally could test up to 188-190 levels. Key resistance holds at 190.
Recent Comments