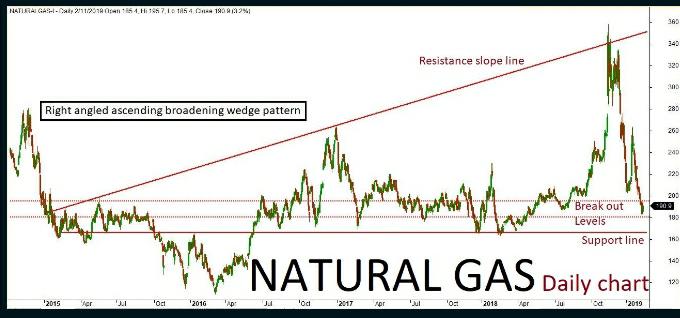
Natural gas daily chart has formed “Right angled ascending broadening wedge” pattern. The last session ended up in bullish trend after few negative rallies inside the chancel. The market is expected to continue on bullish momentum based on the price action, once the same breaks above a key resistance holding at 195.The upside rally could be testing all the way through 200-205 levels in the upcoming sessions. Alternatively, if the key resistance holds strong then the market might retest the same and turn bullish once again The upside rally could test up to 185-180 level. key support holds at 180.
Natural Gas Quant Analysis: 12/Feb/19
Recent Comments