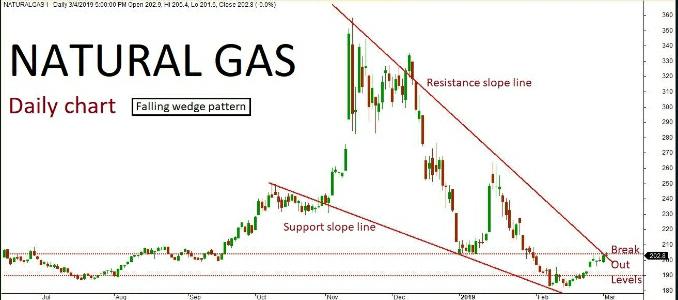
Natural gas daily chart has formed “Falling wedge” pattern. The last few sessions ended up in bullish trend retesting near the channel’s resistance slope line. The market is expected to continue on bullish momentum based on the price action, once the same breaks above a key resistance holding at 205. The upside rally could be testing all the way through 208-212 levels in the upcoming sessions. Alternatively, if the key resistance holds strong then the market might retest the same and turn bearish. The downside rally could test up to 195-190 level. Key support holds at 190.
Natural Gas Quant Analysis: 06/03/19
Recent Comments