
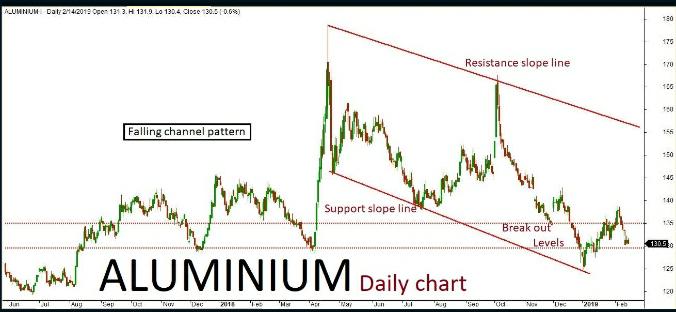
Aluminium daily chart has formed a “Falling channel” pattern. The last few sessions ended up in a bearish trend along with some corrections inside the channel. The market is expected to continue on the bearish trend based on the current price action, once the same breaks below key support holding at 129.50. The downside rally could be testing all the way through 128-127 levels in the upcoming sessions. Alternatively, if key support holds strong then the market might retest the same and turn bullish once again. The upside rally could test up to 133-135 levels. Key resistance holds at 135.
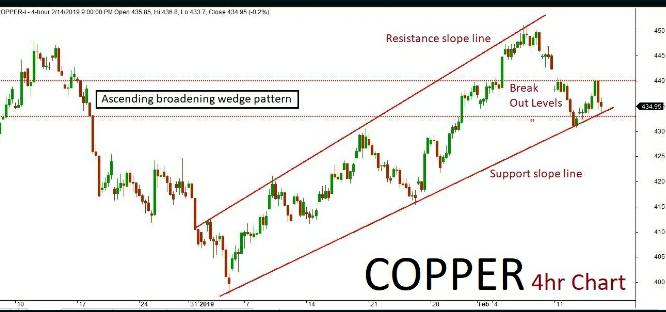
Copper
Copper 4hr chart has formed “Ascending broadening wedge” pattern. The last few sessions been in bullish trend but also consolidated near the channel’s support slope line. The market is expected to continue on bullish momentum based on the current price action, testing all the way through 440 and furthermore levels in the upcoming sessions. Alternatively, if the market breaks below key support holding at 433 then it might turn bearish once again. The downside rally could test up to 430-425 levels. Key resistance holds at 440.
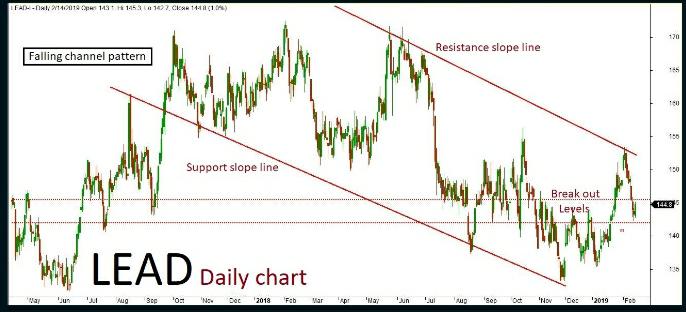
Lead
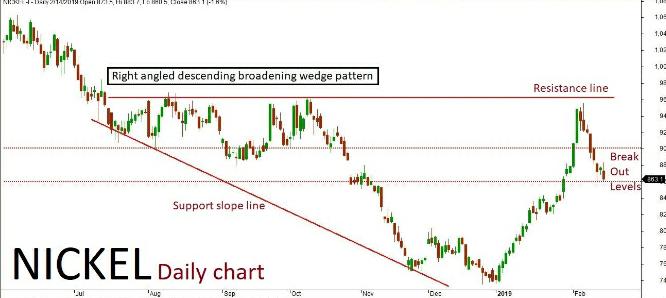
Nickel
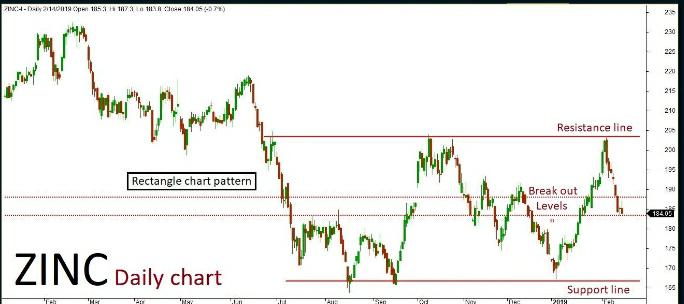
Zinc
Zinc daily chart has formed “Rectangle chart” pattern. The last few sessions ended up bearish in trend along with some corrections inside the channel. The market is expected to continue on bearish momentum based on the current price action. once the same breaks below a key support holding at 183.50. The downside rally could be testing all the way through 182-180 levels in the upcoming sessions. Alternatively, if the key support holds strong then the market might retest up to 186-188 levels. Key resistance holds at 188.
Recent Comments