
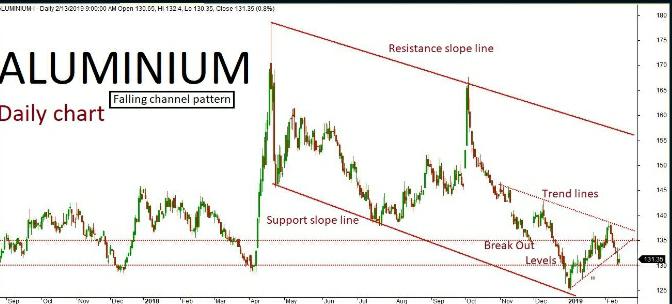
Aluminium daily chart has formed a “Falling channel” pattern. The last session ended up in bullish trend after few negation rallies inside the channel. The market is expected to continue on the bullish trend based on the current price action, testing all the way through 133-135 levels in the upcoming sessions. Alternatively, if the market breaks below key support holding at 130 then it might turn bearish once again. The downside rally could test up to 128-127 levels. Key resistance holds at 135.
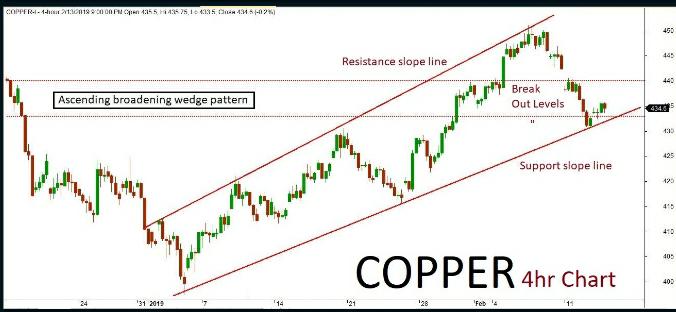
Copper
copper 4hr chart has formed “Ascending broadening wedge” pattern. The last sessions have been in bullish trend after a few negative rallies inside the channel. The market is expected to continue on bullish momentum based on the current price acting, testing all the way through 440 and furthermore levels in the upcoming sessions. Alternatively, if the market breaks below key support holding at 433 then it might turn bearish once again. The downside rally could test up to 430-425 levels. Key resistance holds at 440.
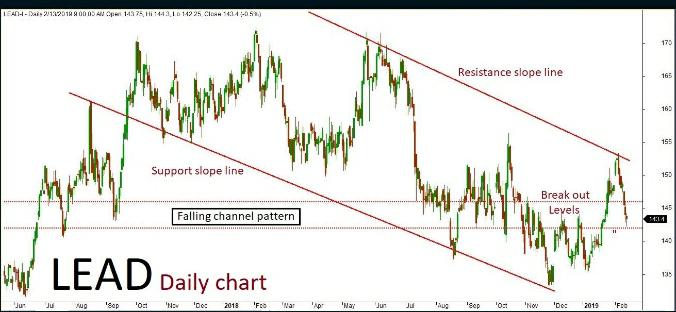
Lead
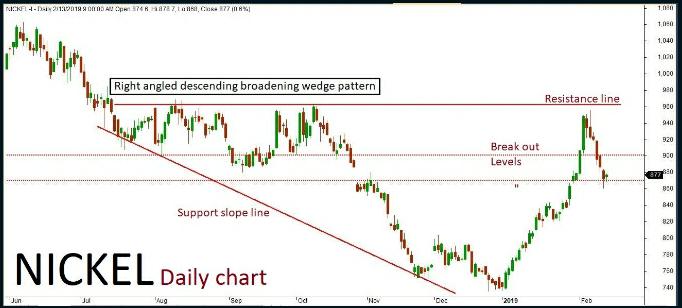
Nickel
Nickel daily chart has formed “Right-angled Descending broadening wedge” pattern. The last session been in bullish trend and consolidated after a few negative rallies inside the channel. The market is expected to continue on the bullish term based on the current price action, testing all the way through 890-900 levels in the upcoming sessions. Alternatively, if the market breaks below key support holding at 870 then it might turn bearish once again. The downside rally could test up to 860-850 levels. Key resistance holds at 900.
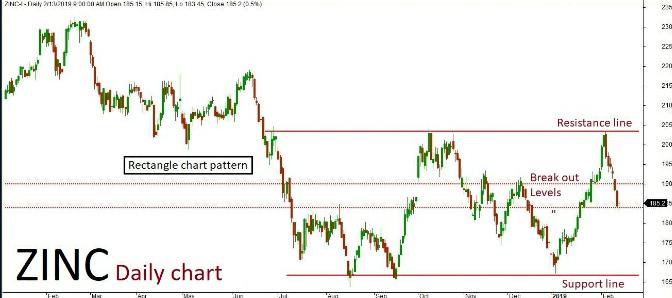
Zinc
Zinc daily chart has formed a “Rectangle chart” pattern. The last session ended up consolidated and retesting after a few negative rallies inside the channel. The market is expected to continue on bullish momentum based on the current price action, testing all the way through 188-190 levels in the upcoming sessions. Alternatively, if the market breaks below key support holding at 184 then it might turn bearish once again. The downside rally could test up to 182-180 levels. Key resistance holds at 190.
Recent Comments