
by Rahul Rana | Apr 4, 2019 | Analysis, Market-Watch Staff
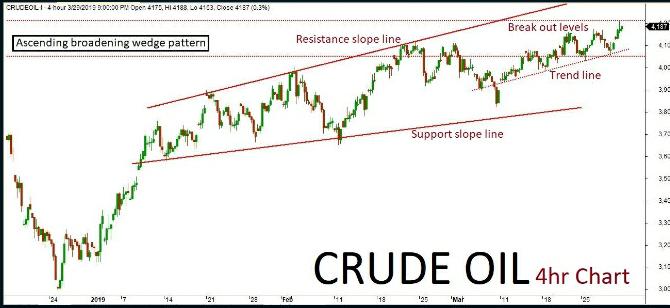
MCX Crude Oil futures technical chart has taken the formation of “Ascending broadening wedge” pattern in 4-hours’ time frame. Previous session ended up in bearish trend after retesting near the channel’s resistance slope line. As per the technical aspects based on the current price action, the market is expected to continue on bearish trend. The negative rally could be testing all the way up to 4220-4150 levels in the upcoming sessions. An alternative scenario indicates that if the market breaks above a key resistance holding at 4350 then it might revise the trend to bullish once again. Such breakout could positive test up to 4400-4450 levels. Key support holds at 4150.
by Rahul Rana | Apr 4, 2019 | Analysis, Market-Watch Staff
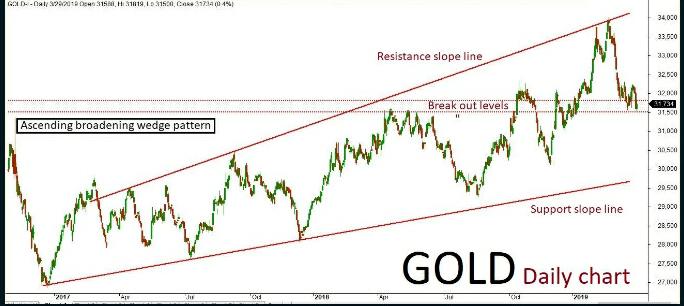
MCX Gold June futures technical chart has taken the formation of “Rising channel” pattern in daily time frame. Last few sessions ended up bearish in trend along with some corrections inside the channel, where the market is expected to continue on bearish momentum. The continuation of the trend will be confirmed once the prices breaks below a key support holding at 31500. The negative rally could be extending all the way up to 31400-31300 levels in the upcoming sessions. An alternative scenario indicates that if the key support holds strong then the market might have a chance to retest the same and revise the trend to bullish once again. The upside rally could test up to 31650-31800 levels. Key resistance holds at 31800.
by Rahul Rana | Apr 3, 2019 | Analysis, Market-Watch Staff
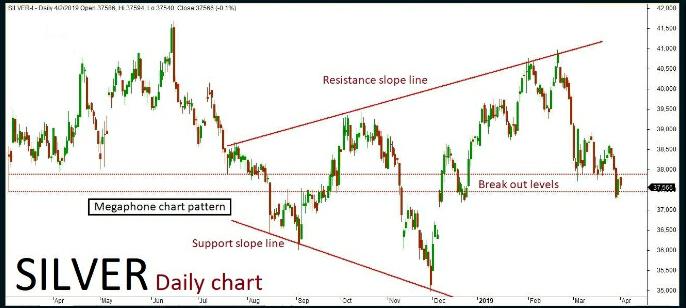
MCX Silver May futures technical chart has taken the formation of “Megaphone chart” pattern in daily time frame. Last few sessions ended up in bearish trend along with some corrections inside the channel, where the market is expected to continue on the bearish trend. The continuation of the trend will only be confirmed once the prices breaks below a key support holding at 37300. The negative rally could be extending all the way up to 37150-36950 levels in the upcoming sessions. An alternative scenario indicates that if the key support holds strong then the market might have a chance to retest the same and revise the trend to bullish once again. The upside rally could test up to 37600-37800 level. Key resistance holds at 37800.
by Rahul Rana | Apr 3, 2019 | Analysis, Market-Watch Staff
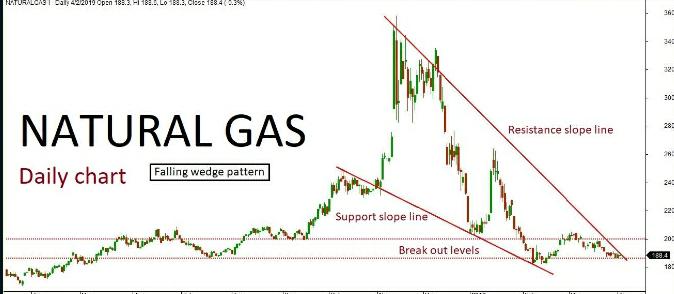
Natural Gas daily chart has formed “Falling wedge” pattern. The last few sessions ended up in bearish trend along with some corrections inside the channel. The market is expected to continue on bearish momentum based on the price action, once the same breaks below a key support holding at 182. The downside rally could be testing all the way through 178-172 levels in the upcoming sessions. Alternatively, if the key support holds strong then the market might retest the same and turn bullish once again. The upside rally could test up to 192-200 level. Key resistance holds at 200.
by Rahul Rana | Apr 3, 2019 | Analysis, Market-Watch Staff
MCx crude Oil futures technical chart has the formation of “Ascending broadening wedge” pattern in 4-hours’ time frame. Previously few sessions ended up in bullish trend along with some corrections inside the channel. As per the technical aspects based on the current price action, the market is expected to continue on bullish trend. The continuation of the trend will be confirmed once the prices breaks above a key resistance holding at 4360. The positive rally could be testing all the way up to 4400-4460 levels in the upcoming sessions. An alternative scenario indicates that if key resistance holds strong then the market might have a chance to retest the same and revise the trend to bearish once again. Key support holds at 4160.
Recent Comments