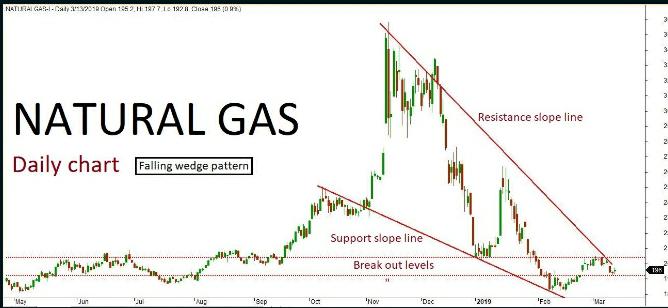
Natural gas daily chart has formed “Falling wedge” pattern. The last few sessions ended up in sideways trend along with some corrections inside the channel. The market is expected to continue on bearish momentum based on the price action, testing all the way through 188-182 levels in the upcoming sessions. Alternatively, if the market breaks above a key resistance holding at 198 then it might turn bullish once again. The upside rally could test up to 204-210 level. Key support holds at 182.
Natural Gas Quant Analysis: 18/03/19
Recent Comments